
Traders and investors of all walks have embraced ETFs over the years for their ease-of-use, cost-efficiency, and the sheer diversity in offerings, that continues to grow. The benefits of exchange-traded products over their mutual fund counterparts extends beyond the well-known laundry list that makes them the preferred investment vehicle for many. As such, it shouldn’t come as a surprise that ETFs have made their way onto countless radar screens given the clues they can offer about the inner workings of the market.
Using ETFs as Market Indicators
By simply tracking the daily, weekly, or monthly price movements of ETFs, investors can get a sense of how other participants feel about that particular corner of the market. For example, if the SPDR S&P 500 (SPY ), which is considered to be a barometer for the broad U.S. equity market, is rallying then you can infer that bullish forces are in control on Wall Street. While this is an elementary example in the case of tracking the U.S. stock market, which is among the most liquid asset classes in the world, it’s far more powerful when you consider other assets that were previously much harder to access [see How to Spot a Sector Rotation with ETFs].
In the case of foreign equity ETFs, these instruments have helped to “put a price” on asset classes that were previously hard to track for the average investor. In the case of the more granular offerings, like sector-focused or investment style-focused ETFs, these instruments make it easier to gauge investors’ sentiment through a variety of lenses, each with its own set of advantages and limitations.
What is the Consumer Discretionary / Staples Ratio?
One of the ways that ETFs can provide insights is when you consider their performance in the context of pairs; think of this as a ratio of the returns of two funds, or in other words, the price of one ETF divided by the other. One pair that is known to bear some predictive power over future broad equity market returns is the Consumer Discretionary / Staples ratio. Let’s consider the components of this ratio:
- Consumer Discretionary Select Sector (XLY ): This sector ETF serves as a proxy for the performance of companies engaged in the business of selling “hard” and “soft” goods; this includes household durables (like furniture and home appliances) and leisure, textile, and luxury goods, respectively. These products fall under the “discretionary” umbrella because they boast relatively elastic demand, meaning that price changes have a meaningful impact on consumers’ demand for them.
- Consumer Staples Select Sector (XLP ): This sector ETF serves as a proxy for the performance of companies engaged in the business of selling staple foods and household goods, which boast relatively inelastic demand, meaning that price changes don’t have much of an impact on consumers’ demand for them.
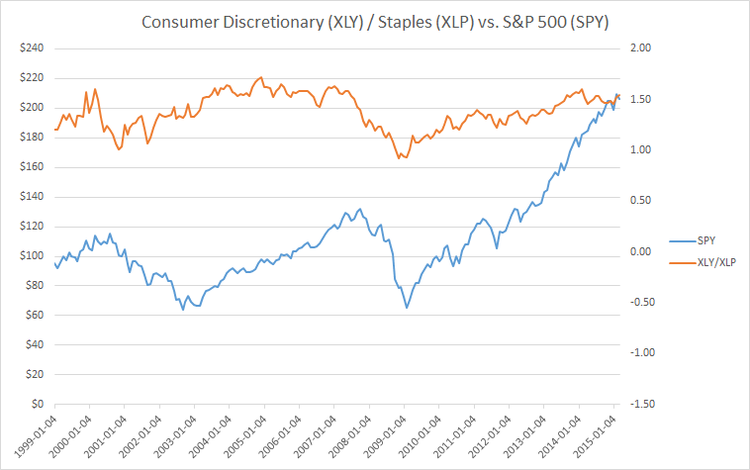
Consider the chart below, which showcases the Consumer Discretionary / Staples ratio plotted against the most well-known broad market barometer, the SPDR S&P 500 (SPY ). The consumer ETF ratio is comprised of the two SPDR sector ETFs profiled above, and more specifically, the values plotted below are the adjusted monthly opening prices of XLY divided by XLP’s since inception, from December 1998 through March 2015 [see also Sector SPDR ETF Returns Since Inception]:
So what does this ratio actually measure? In its simplest terms, it measures the performance of discretionary stocks relative to staples. When this ratio is rising, it means that discretionary stocks are outperforming their staple counterparts; this implies improving confidence regarding future economic growth expectations, given that rising demand for elastic goods coincides with periods of strong consumer spending.
Likewise, when this ratio is falling, it means that demand for discretionary goods is falling, which can suggest that an economic slowdown is on the horizon since demand for these goods is more sensitive to changes in consumers’ spending habits than their staple counterparts [see also Do Volume Spikes Signal Trend Reversals in the SPDR S&P 500].
Putting It in Context
First, let’s consider the historical range of the consumer ETF ratio, XLY/XLP (blue, right-axis); as we can see, this ratio has oscillated between 0.90 and 1.60 for the most part. Next, let’s consider what happens when the ratio hits these lower and upper extremes; more specifically, we want to see how the broad market, SPY (orange, left-axis), behaves as the ratio fluctuates around these levels [see also 3 Contrarian Indicators ETF Investors Must Know].
Note how the ratio tends to steeply decline after hitting its upper extreme just above 1.50; this is identified by vertical green lines following the horizontal yellow lines. More importantly, notice the return of SPY following these instances in 2000 and 2007 where the ratio tops out; SPY’s performance to the right of the green lines in these instances is clearly negative, and it coincides with the past two bear markets. While it’s nowhere near an exact science, the graph above does suggest that the Consumer Discretionary / Staples ratio boasts some predictive power over future broad U.S. equity market returns.
To summarize, when the ratio tops out and turns lower, it suggests that investors’ risk appetite has peaked; this is evidenced by defensive staples starting to outperform their riskier discretionary counterparts, which is contrary to the trend that has persisted up to that point. This reversal, or change in leadership from staples to discretionary, then hints at a bigger reduction in risk appetites; this is evidenced by the negative performance of the broader equity market in the months that follow these turning points when the ratio is near its upper extreme.
The Bottom Line
The Consumer Discretionary / Staples ratio may offer some valuable insights regarding investors’ risk appetite; historically, this ratio has served as a decent gauge for identifying major turning points in the broader equity market before they actually happen. However, it’s important to keep in mind that as with any indicator, this metric has its limitations; for instance, this ratio is not very helpful in identifying the end of a bear market, seeing as how it turned higher in 2000, which was well before the broad market bottom. All in all, investors would be best off to use this indicator in conjunction with other tools and analysis before deciding to pull the buy/sell trigger.
Follow me on Twitter @SBojinov
[For more ETF analysis, make sure to sign up for our free ETF newsletter]
Disclosure: No positions at time of writing.

