ETFdb Logo
ETFdb Logo
  • ETF Database
  • Channels
    • Active ETF
    • Alternatives
    • Beyond Basic Beta
    • China Insights
    • Climate Insights
    • Commodities
    • Core Strategies
    • Crypto
    • Disruptive Technology
    • Dividend
    • Dual Impact
    • Emerging Markets
    • Energy Infrastructure
    • ESG
    • ETF Building Blocks
    • ETF Education
    • ETF Strategist
    • Fixed Income
    • Free Cash Flow
    • Future ETFs
    • Global Diversification
    • Gold & Silver Investing
    • Innovative ETFs
    • Institutional Income Strategies
    • Leveraged & Inverse
    • Managed Futures
    • Market Insights
    • Megatrends
    • Modern Alpha
    • Multi-Asset
    • Night Effect
    • Portfolio Strategies
    • Retirement Income
    • Richard Bernstein Advisors
    • Tax Efficient Income
    • Thematic Investing
    • Volatility Resource
  • Tools
    • ETF Screener
    • ETF Country Exposure Tool
    • ETF Sector Tracker Tool
    • ETF Database Categories
    • Head-To-Head ETF Comparison Tool
    • ETF Stock Exposure Tool
    • ETF Issuer Fund Flows
    • Indexes
    • Mutual Fund To ETF Converter
    • ETF Data for Journalists
    • ETF Nerds
  • Research
    • First Bitcoin ETF
    • ETF Education
    • Equity Investing
    • Dividend ETFs
    • Leveraged ETFs
    • Inverse ETFs
    • Index Education
    • Index Insights
    • Top ETF Sectors
    • Top ETF Issuers
    • Top ETF Industries
  • Webcasts
  • Themes
    • AI ETFs
    • Blockchain ETFs
    • See all Thematic Investing ETF themes
    • ESG Investing
    • Marijuana ETFs
  • Multimedia
    • ETF 360 Video Series
    • ETF Trends on Videos
    • ETF Trends on Podcasts
    • ETF Prime Podcast
  • Company
    • About Us
    • Swag Store
  • PRO
    • Pro Content
    • Pro Tools
    • Advanced
    • FAQ
    • Pricing
    • Free Sign Up
    • Login
  1. Equity ETFs
  2. The Complete History of the Dow Jones Industrial Average
Equity ETFs
Share

The Complete History of the Dow Jones Industrial Average

Jared CummansJun 24, 2015
2015-06-24

The Dow Jones Industrial Average is one of the oldest and most used benchmarks across the globe. Consisting of 30 of the biggest companies in the world, the benchmark has been through a lot since it was founded in the late 19th century. Here is a quick primer on the history of the DJIA, by the numbers.

Decade by Decade

The index has put in a dozen full decades with a few years to spare on the side. Over that time period, the Dow has seen just three decades of negative returns, giving it a 75% chance of turning in a positive decade.


Content continues below advertisement

*2010s data as of 5/22/2015

While the above chart does well to outline some of the most prosperous and most catastrophic 10-year stretches, looking at the index’s annual price gives investors an idea of just how much it has soared in recent years.

Visualized another way, here’s a look at the daily performance of the Dow since its inception (note the significant increase in volatility in the late 20s and 80s).

Daily Change of DJIA

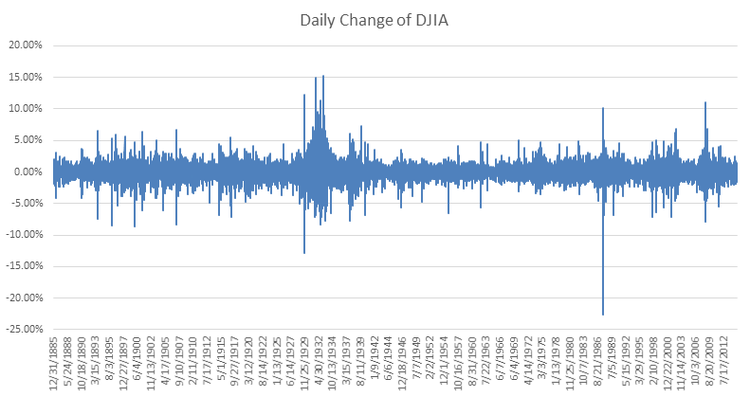
Here’s yet another way to look at the daily historical volatility of the DJIA.

The Best and Worst

Starting with monthly returns, we outline some of the impressive and most treacherous stretches the index has ever seen.

The DJIA has seen years where it has fallen as much as 52% and others where it has gained more than 80%.

Fun Facts

  • The Dow Jones Industrial Average Index was shut down from 7/30/1914 to 12/12/1914 because of World War I.
  • It took the index 31,728 days from its inception to cross the 1,000 mark. It took just 36 days to move from 10,000 to 11,000.
  • It would take just 44 of the Dow’s best sessions (by point gain) to go from 0 to its close on 5/22/2015 of $18,232.02. By contrast, it would take just 38 of the Dow’s worst sessions (by point losses) to bring that figure back to 0.
  • Since inception, the Dow has had just one down year that ended in a “5″, as it suffered a slight pullback in 2005.

ETFs

While the DJIA itself is difficult to invest in, investors can easily utilize the Dow Jones Industrial Average ETF (DIA B+), the only fund to grant exposure to the standard DJIA. The fund has well over $11 billion in total assets, making it one of the largest and most liquids ETFs in the world.

The Bottom Line

The Dow Jones Industrial Average is one of the oldest and most prominent investing benchmarks in the world and figures to stay that way for generations to come.

All data as of 5/22/2015.

Follow me on Twitter @JaredCummans

[For more ETF analysis, make sure to sign up for our free ETF newsletter]

Disclosure: No positions at time of writing.

» Popular Pages

  • Tickers
  • Articles

Jan 31

A Recap of the Night Effect in January

Jan 31

E-Commerce Spending Exceeds $1 Trillion in 2022

Jan 31

Vanguard: Fixed Income Seeing Strong Flows

Jan 31

Confluence Asset Allocation Quarterly Q1 2023

Jan 31

Embrace a “Dividend Decade” in a Quality Dividend ETF

Jan 31

ETF Prime: Disruptive Tech and International Stocks

Jan 31

Emerging Markets Ex China ETF Launched by Strive

Jan 31

QINT Catches Eyes With Quality International Equities

Jan 31

Investors Look to Equal-Weight and Quality Factors

Jan 31

Bonds Facing a Better Year: Capture With BNDI

QQQ

Invesco QQQ Trust

SPY

SPDR S&P 500 ETF Trust

VOO

Vanguard S&P 500 ETF

VGT

Vanguard Information...

SMH

VanEck Semiconductor ETF

XLK

Technology Select Sector SPDR...

VTI

Vanguard Total Stock Market...

SOXX

iShares Semiconductor ETF

BLOK

Amplify Transformational Data...

META

Roundhill Ball Metaverse ETF

Loading Articles...
Help & Info
  • Contact Us
Tools
  • ETF Screener
  • ETF Analyzer
  • Mutual Fund to ETF Converter
  • Head-To-Head ETF Comparison
  • ETF Country Exposure Tool
  • ETF Stock Exposure Tool
  • ETF Performance Visualizer
  • ETF Database Model Portfolios
  • ETF Database Realtime Ratings
  • ETF Database Pro
More Tools
  • ETF Launch Center
  • Financial Advisor & RIA Center
  • ETF Database RSS Feed
Explore ETFs
  • ETF News
  • ETF Picks of the Month
  • ETF Category Reports
  • Premium Articles
  • Alphabetical Listing of ETFs
  • Best ETFs
  • Browse ETFs by ETF Database Category
  • Browse ETFs by Index
  • Browse ETFs by Issuer
  • Compare ETFs
Legal
  • Terms of Use and Privacy Policy
  • © 2023 VettaFi LLC. All rights reserved.
Follow ETF Database
Follow ETF Database

Advertisement

Is Your Portfolio Positioned With Enough Global Exposure?

ETF Education Channel

How to Allocate Commodities in Portfolios

Tom LydonApr 26, 2022
2022-04-26

A long-running debate in asset allocation circles is how much of a portfolio an investor should...

Core Strategies Channel

Why ETFs Experience Limit Up/Down Protections

Karrie GordonMay 13, 2022
2022-05-13

In a digital age where information moves in milliseconds and millions of participants can transact...

}
X