

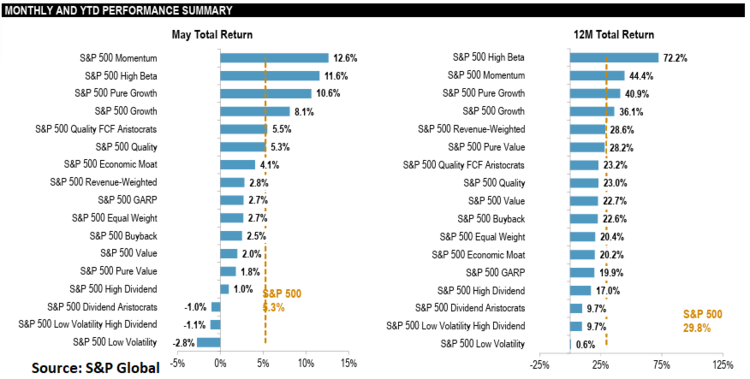
Physics tells us that something in motion stays in motion. With a month-to-date gain of 7.4% for momentum, according to data from S&P Global, other style-box factors essentially got out of momentum’s way.
Momentum’s strength comes on the heels of broader equities resilience as evidenced by a 5.3% rise in May. This marked an eight-week winning streak, the longest positive run since 2023. From a macro level, optimism surrounding a U.S.-Iran resolution, cooling oil prices, and stronger-than-anticipated corporate earnings have been prime performance catalysts.
A Momentous May
The S&P 500 Momentum’s 7.4% gain in May marks its second-best relative month and its third-best absolute monthly performance since the index’s inception almost 12 years ago. Rolling three-month (from March to May) data from S&P further revealed that the momentum index exceeded the broader benchmark by 16.0%. For perspective, this represents the single greatest three-month run in its nearly 12-year history.
With such a strong performance run, it’s natural to think that a pullback is inevitable. S&P data, however, shows signs of historical resilience. When evaluating the top 10 three-month excess performance periods since 2014, the results of subsequent three-month periods are practically a 50-50 coin toss. Momentum continued to beat the benchmark in half of the instances, while trailing in the other half. When pullbacks did occur, none were severe enough to nullify the previous gains achieved during the initial run.
Thank You, Tech
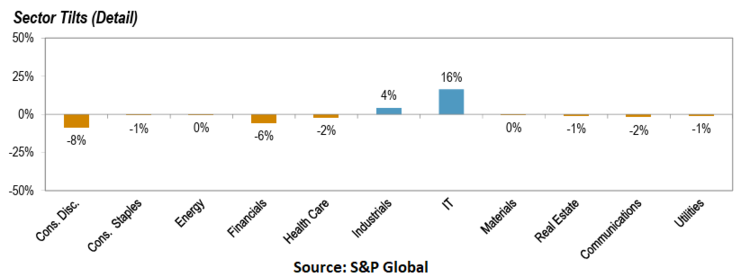
It’s no surprise that the high-octane tech sector fuels momentum’s run. The artificial intelligence rally continues to push AI-focused stocks into the upper strata of performance. It appears that this will continue in the foreseeable future.
S&P data further revealed that tech has contributed nearly half of the S&P 500’s total performance over the last decade, but its specific weighting inside the S&P 500 Momentum Index has varied. The difference in tech’s weight relative to the benchmark ranged from +19.4% to -26.6%. This is the largest range of all the Global Industry Classification Standard (GICS) sectors, which underscores momentum’s ability to ride the wave of high-performing stocks across various sectors. Right now, momentum surfers are still catching the biggest waves in tech.
Momentum ETFs
Investors looking to get exposure to the momentum factor through an ETF investment vehicle can typically look towards the heaviest hitters. This includes the Invesco S&P 500 Momentum ETF (SPMO ) as well as the iShares MSCI USA Momentum Factor ETF (MTUM ). With expense ratios of 13 and 15 bps, respectively, SPMO and MTUM also offer cost-efficient options in today’s inflationary environment.
One fund that may not be on the proverbial radar initially is the Fidelity Momentum Factor ETF (FDMO ). Not to be denied as another cost-effective option, FDMO also has a competitive expense ratio of 15 bps.
FDMO tracks the Fidelity U.S. Momentum Factor Index. In order for companies to be included in the index, they must exhibit momentum-based characteristics related to total returns (cumulative and volatility-adjusted), positive earnings-per-share (EPS) surprises, as well as low average short interest in the company. The latter can indicate what short sellers are doing in the market, which could portend to future loss of momentum due to decreased sentiment for a specific stock.
Rather than stick to momentum-focused names in the large-cap space, FDMO’s universe also includes mid-caps. This gives FDMO an added growth component, as midcaps provide a balance of stability inherent in large-caps and a growth component related to small-caps.
| Invesco S&P 500 Momentum ETF | iShares MSCI USA Momentum Factor ETF | Fidelity Momentum Factor ETF | |
|---|---|---|---|
| Ticker | SPMO | MTUM | FDMO |
| Issuer | Invesco | BlackRock (iShares) | Fidelity |
| Inception Date | October 9, 2015 | April 16, 2013 | September 12, 2016 |
| Expense Ratio | 0.13% | 0.15% | 0.15% |
| Assets Under Management | ~$20.5 Billion | ~$27.6 Billion | ~$914.2 Million |
| Number of Holdings | ~101 | ~128 | ~139 |
| Underlying Index | S&P 500 Momentum Index | MSCI USA Momentum SR Variant Index | Fidelity U.S. Momentum Factor Index |
| Selection Universe | S&P 500 stocks displaying high volatility-adjusted recent price performance over the past year. | Large- and midcap U.S. equities exhibiting high relative price momentum with liquid trading capacity. | Large- and midcap U.S. companies selected via a composite momentum score (price trends, earnings surprises, and short interest data). |
High-Beta ETFs
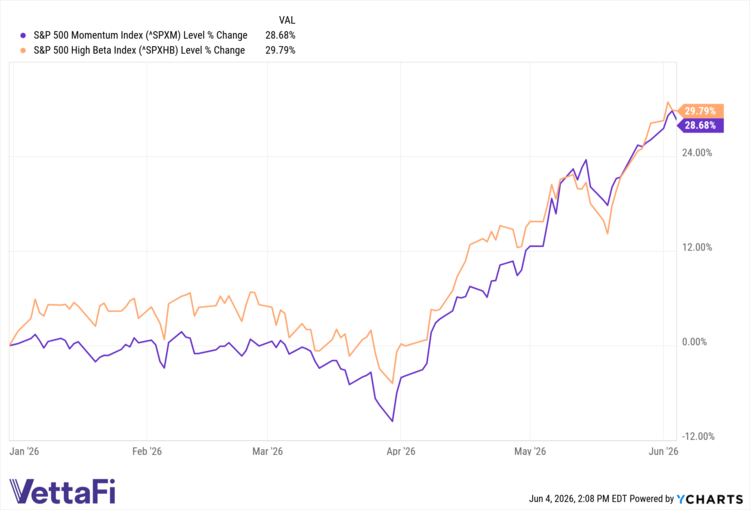
A runner up in May’s performance run was high-beta strategies, with the S&P 500 High Beta Index hitting 11.6%. High-beta strategies are structurally engineered to exhibit greater volatility and price sensitivity relative to the broader market. When investor sentiment leans heavily on the bullish side, high-beta strategies tend to prosper, and vice versa.
That warrants a look at ETFs focused on high-beta strategies that provide tactical equity exposure for those who don’t mind the added volatility. For investors looking for broad-based exposure, the Invesco S&P 500® High Beta ETF (SPHB ) will be their proverbial cup of tea. It tracks the aforementioned S&P 500 High Beta Index with an expense ratio of 25 bps. Adrenaline-fueled short-term traders who want to turn that cup of tea into three shots of espresso should seek the Direxion Daily S&P 500 High Beta Bull 3X ETF (HIBL ).
| Invesco S&P 500 High Beta ETF | Direxion Daily S&P 500 High Beta Bull 3X | |
|---|---|---|
| Ticker | SPHB | HIBL |
| Issuer | Invesco | Direxion |
| Inception Date | May 5, 2011 | November 7, 2019 |
| Expense Ratio | 0.25% | 0.98% (Net) |
| Assets Under Management | ~$1.02 Billion | ~$104.8 Million |
| Number of Holdings | ~101 | ~100 (Leveraged Index Overlay) |
| Underlying Index | S&P 500 High Beta Index | S&P 500 High Beta Index (300% Target) |
| Selection Universe | The 100 stocks from the S&P 500 Index that have shown the highest sensitivity (beta) over the past 12 months. | Leveraged target tracking the same 100 high-beta components to deliver 3x daily performance via financial swaps. |
Originally published on Advisor Perspectives.
For more news, information, and analysis, visit the Innovative ETFs Content Hub.

