
While the long-term buy-and-hold strategy is favored by many more passive investors, savvy and active traders have also embraced another form of trading — swing trading. Swing traders attempt to capture the bulk of a price move, and they have gravitated en masse to using ETFs as their trading vehicle of choice thanks to the unparalleled liquidity, ease-of-use and cost efficiency of these products.
With over 1,600 exchange-traded funds on the market, active swing traders have no shortage of instruments at their fingertips, allowing them to implement any number of strategies across a global basket of asset classes.
Swing Trading 101
Swing trading is a form of trading that attempts to capture a profit from an ETF price move within a time frame of one day to a few weeks. There is no set time limit on a swing trade, but the idea is to get in and out while capturing a good chunk of a move, and then find something else that is moving or about to move. Trades typically last at least a full day or more, but positions are rarely held for more than a few weeks.
Trades lasting longer than this typically start to see multiple moves up and/or down, which contradicts the swing trading philosophy of capturing one major move (or a part of it) and then getting out.
Since swing traders are only concerned with a short-term move, technical analysis is the primary tool used to find trade candidates. Whether a move is up (bullish) or down (bearish) doesn’t matter, as most ETFs can be bought as well as shorted—selling first and buying back later, at hopefully a lower price, to profit from a declining price. Chart pattern breakouts or surges in momentum commonly attract swing traders, who jump on board attempting to ride the move. Technical indicators reaching extreme levels also attract swing traders, as well as strongly trending ETFs or those in well-defined trading ranges. All such technical occurrences provide potential opportunities for swing traders looking to capture quick profits.
Be sure to read our ETF Technical Trading FAQ.
What To Trade?
As a swing trader, the “trading environment” is of primary concern. A sedate ETF offers little profit potential, and therefore isn’t an ideal swing trade candidate, unless it becomes more active. On the other hand, ETFs that quickly move back and forth between support and resistance—a trading range—or show aggressive price action in one direction—strong trends—are ideal swing trade candidates.
Trading environments change over time; therefore, an ETF providing great swing trades this week on the long (bullish) side, may not be suitable for swing trades next week, or may provide opportunities on the short (bearish) side.
See our list of the Top 100 ETFs by Trading Volume.
How to Swing Trade ETFs
Before making a swing trade, it is import to pick the right ETF. ETFs that have a good swing trading environment, as well as relative high volume, are ideal. A high level of activity both in price and volume allows swing traders to enter and exit with ease. Low volume ETFs may not provide adequate liquidity at the time you wish to accumulate or unload your position. Due to the short time frame of swing trades, being able to attain or unload your position when you want is crucial, as market conditions can change rapidly.
Upon finding suitable ETFs to trade, the next step is to find potential trades. Trades can be based off any technical method that forecasts a strong price movement over the next several days or weeks. No strategy is capable of forecasting all price moves, nor will it always accurately predict the direction or magnitude of the moves it does forecast. While there is always a risk of loss in trading, swing traders use methods and indicators such as chart pattern breakouts or increasing volatility to find potentially profitable moves.
Chart patterns are geometric shapes that are visible on the price charts of an EFT, and they often forecast when volatility is likely to increase, and in which direction – all of this is key information for a swing trader (see also 3 ETF Trading Tips You Are Missing).
Take the “triangle” chart pattern for example. A triangle is created by the price action of an ETF becoming more sedate or constrained, as Figure 1 shows. Like a compressed spring, eventually the price action will expand again, and often that is triggered by the price moving back outside the confines of the triangle. This is called a chart pattern breakout and signals swing traders to enter the ETF in the direction of the breakout, as a strong short-term move is likely starting.
The SPDR Gold Trust (GLD) created such a swing trade opportunity during the summer of 2012:
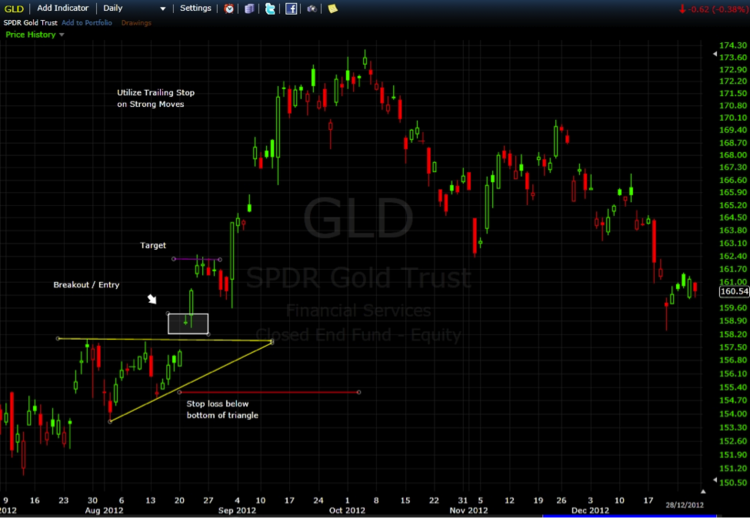
The yellow lines mark the triangle formation on the chart. A clear breakout occurs on August 21, as the ETF opened and closed above the triangle, signaling a breakout and entry into a long swing trade at roughly $158.80 a share. To manage risk, a stop loss order is placed just outside the opposite side of the triangle as the breakout, or approximately at $155.80 a share.
How to Exit a Swing Trade
Exit strategies vary. Many traders use a trailing stop; as the price moves up the stop loss order is also moved up to lock in profits. This is useful when a strong move occurs such as the one shown in the chart above.
Target prices are also commonly calculated before the trade is made, and when that price is reached the trade is closed. Chart patterns provide an approximate profit target by adding (upward breakout) or subtracting (downward breakout) the height of the formation to or from the breakout price. For example, the triangle has a height of roughly $4.25 at its tallest point. This is added to the breakout price (which may not be entry price as the price can “gap” as it did here) of $157.96 to provide a target of $157.96 + $4.25 = $162.21, which was hit several days after the breakout.
Be sure to also see the 5 Most Important ETF Lessons In Pictures.
When a trend is underway, isolating trend continuation points (such as recent support and resistance) after a correction has occurred also provide great swing trade possibilities. In early October 2012, the Dow Jones Industrial Average ETF (DIA) made a series of lower highs, indicating the prior uptrend was likely over. This was later confirmed by the significant price decline in late October:
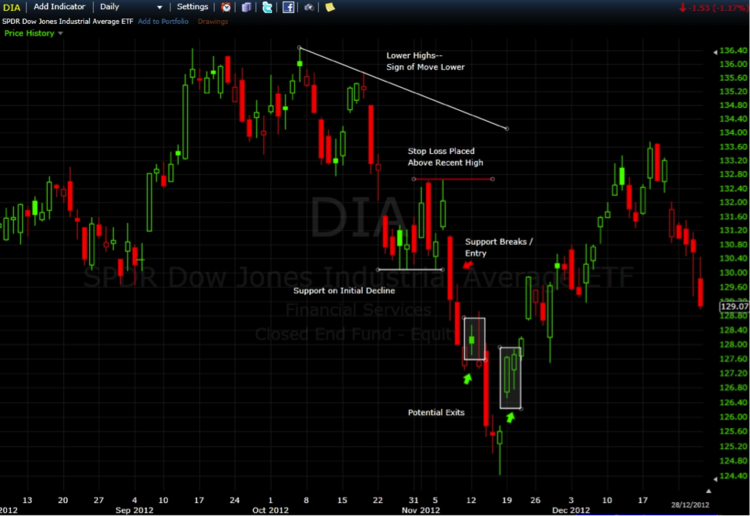
As the downtrend begins to show signs of emerging, swing traders are looking for an opportunity to get short. Support was created on the initial decline at $130.09 (white horizontal line), and that now becomes a focal point. If the ETF moves below that, which it did on November 7, it signals a short entry and a likely further fall for the ETF. A stop is placed above a recent short-term high point to limit risk, in this case at $132.65 a share.
Exits when using a trending strategy are more subjective. Two potential exits are highlighted by the rectangles on the chart. Since swing trades are looking to capture swift moves, these counter-trend green (up) bars represented potential reversals and therefore possible exit points for a swing trader.
The Bottom Line
There are likely as many strategies for swing trading as there are ETFs. Any number of strategies and ETFs can be used in a profitable manner to capture price moves, but the winners generally stick to ETFs that are active in both price and volume. Successful swing traders also get in and out of the market quickly; leaving some profit on the table is okay, but capturing quick-high probability profits and limiting risk is what is important. Opportunities abound, so take some time to develop your own strategies, write down your plan, practice and, when you are ready to accept the risk, implement.
For more ETF analysis, make sure to sign up for our free ETF newsletter.
Disclosure: No positions at time of writing.

