There are thousands of technical indicators used by traders to determine the optimal time and price to buy and sell securities, but the 200-day moving average is arguably the most widely followed by the market. When the market price for a security is trading above the 200-day moving average, traders tend to be bullish on the security, while a price below the moving average is considered to be bearish – a simple snapshot of where a security stands.
In this article, we’ll take a look at some shortcomings associated with exclusively using the 200-day moving average and some alternative forms of analysis for exchange-traded funds (“ETFs”).
A Quick Primer
Moving averages are designed to smooth out prices by averaging a given number of previous closing prices that are reflected in the current period’s context. Traders watch a number of different moving averages, including the 20-, 50-, 100-, and 200-day moving averages to provide insights into where trends are headed over the short- and long-term. Often times, traders also watch the interactions between these short- and long-term averages.
There are several types of moving averages:
- Simple Moving Average (SMA) – The average of a series of prices.
- Exponential Moving Average (EMA) – The average of all historical ranges starting at a specified point and doesn’t remove older prices.
- Weighted Moving Average (WMA) – The average of a series of prices that’s linearly weighted to ensure that recent prices have a greater impact.
Often times, traders will use the 200-day simple moving average as a key indicator in determining when to buy and sell an ETF. Traders may enter into a long trade when the price crosses above the 200-day moving average, while entering into short trade when the price crosses below the key moving average. As we will see, there are many potential pitfalls with this approach and traders may want to take a more holistic approach.
Problems with Lag
The 200-day moving average provides a snapshot of a security’s trend over the past year. While these insights are certainly helpful, moving averages are lagging indicators by definition, which means they provide little in the way of predictive value. Long-term trends are important when establishing the context for a given trade, but they don’t help very much with determining an appropriate price and time to actually execute a trade.
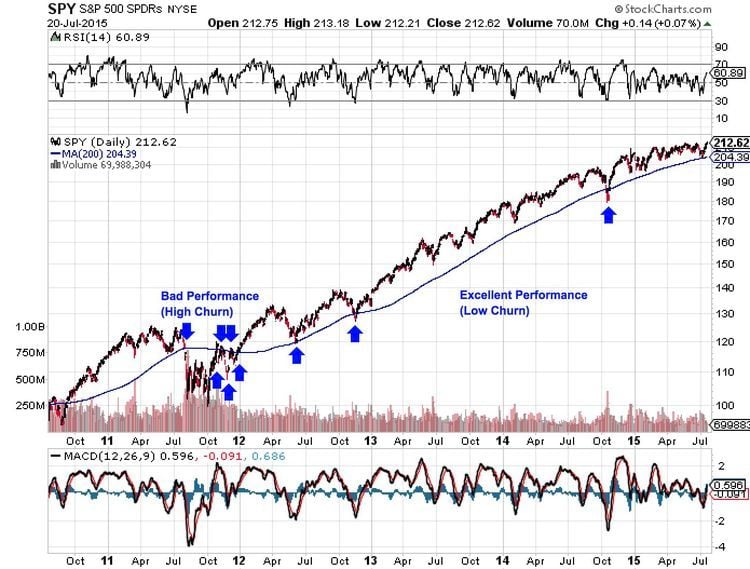
In Figure 1, the S&P 500 SPDR’s (SPY ) 200-day moving average performs great when the ETF is trending, but generates dismal performance during a sideways market. Traders that placed all of these trades would have realized significant losses from the high churn rate. The indicator also produces three false signals during the prolonged uptrend, where traders might have sold and repurchased the ETF at inopportune times.
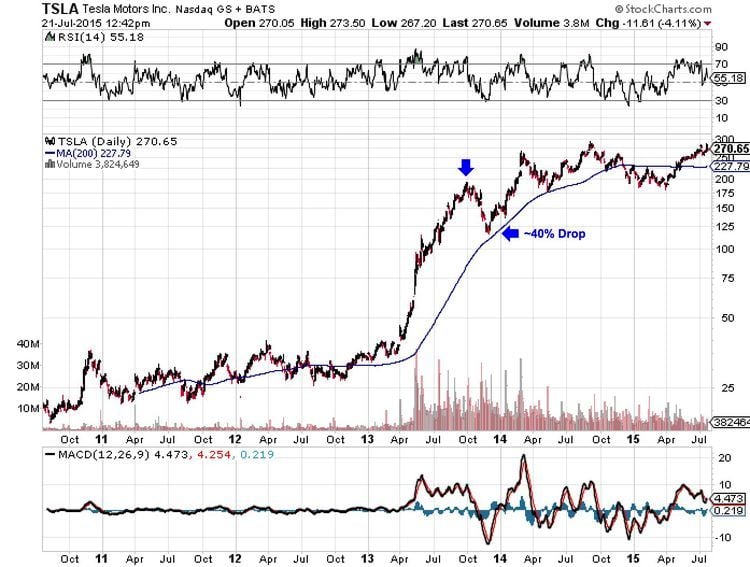
Figure 2 highlights a second key risk associated with using 200-day moving averages exclusively when timing the entry and exit of trades. Since TSLA’s stock became volatile, the 200-day moving average deviated substantially from the market price, which created the potential for a nearly 40% drop before a stop-loss was even close to being triggered. Traders that didn’t enter the trade until later in the game could have seen significant losses on the trade.
In summary, the lagging nature of the 200-day moving average makes it risky to use as an exclusive indicator for determining entry and exit points. Sideways markets generate unnecessary churn rates that can prove very costly, while strongly trending markets create a situation where significant losses are possible before any signals are generated. Fortunately, these risks can be avoided by using the indicator in conjunction with other factors.
Piece of the Puzzle
Many traders use the 200-day moving average when determining the direction of a given trade and then rely on other indicators to determine entry and exit points. After all, a key mantra among successful traders is “the trend is your friend”, which means that it’s generally a bad idea to place contrarian trades without a very good rationale. The 200-day moving average is particularly useful to show direction in short-term charts where it’s not immediately obvious.
These insights should be combined with other forms of analysis, including other technical and fundamental considerations before making an investment decision. For instance, reversal and continuation chart patterns can be helpful when determining when to enter and exit a trade, while changing fundamentals may suggest an imminent reversal regardless of where the price may lie relative to the 200-day moving average or other technical indicators.
When it comes to technical indicators, chart patterns and candlestick analysis are two great forecasting tools that can supplement technical indicators like the 200-day moving average. A head and shoulders pattern, for instance, can forecast an eventual drop in a stock price well before it crosses below the 200-day moving average. Similarly, bullish engulfing that occurs near a 200-day moving average could indicate that it’s not time to sell quite yet.
Traders and investors should also keep a close eye on fundamental factors that could influence the ETFs they’re trading. In some cases, changing fundamentals could encourage a trader to immediately exit a trade before it crosses below the 200-day moving average. In other cases, an ETF could take a plunge below the 200-day moving average even though the long-term picture remains in tact, which could encourage traders to hold onto the ETF.
Key Takeaway Points
- The 200-day moving average is one of the most popular technical indicators watched by traders and investors, since it provides an excellent look at where a stock is trending.
- Relying exclusively on the 200-day moving average creates a significant risk for portfolio churn and potentially significant losses in strongly trending markets.
- Despite its popularity, traders and investors should incorporate other technical and fundamental factors into their analysis to get a complete picture.
- Chart patterns and candlestick analysis are great technical tools to use in conjunction with technical indicators, while traders and investors should always be keeping an eye on fundamental developments to incorporate into their analysis.

