
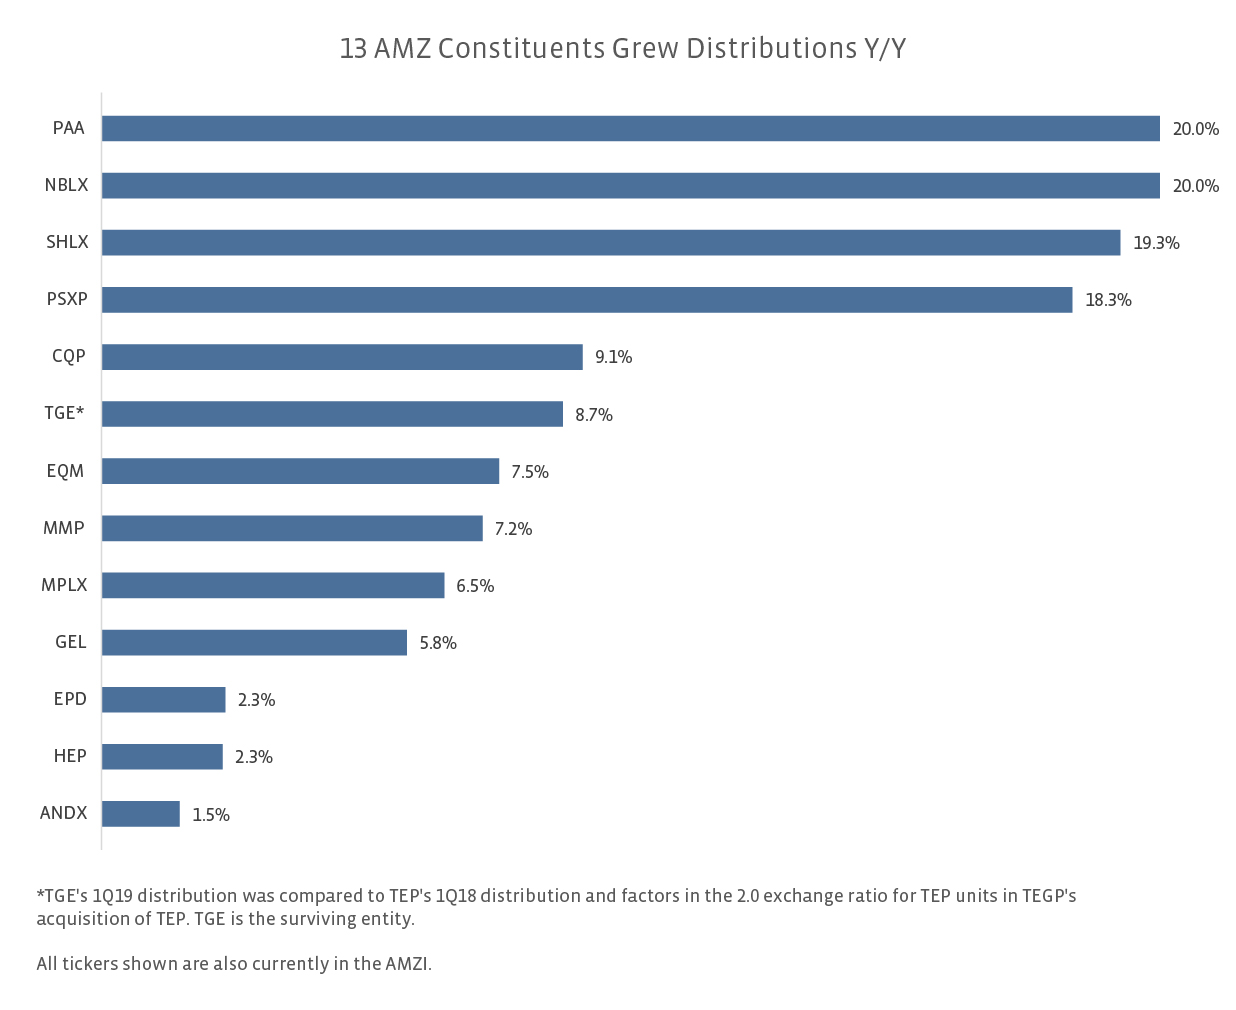
Most notably for 1Q19, after holding its distribution flat for six quarters since its 3Q17 cut, Plains All American (PAA) announced a 20% distribution increase from $0.30 to $0.36 per unit per quarter. The jump in the distribution coincided with PAA achieving its deleveraging goal. Over the next few years, PAA anticipates distribution growth of ~5% annually contingent on achieving its targeted financial metrics. The resumption of growth is positive to see following the painful cuts in the past.
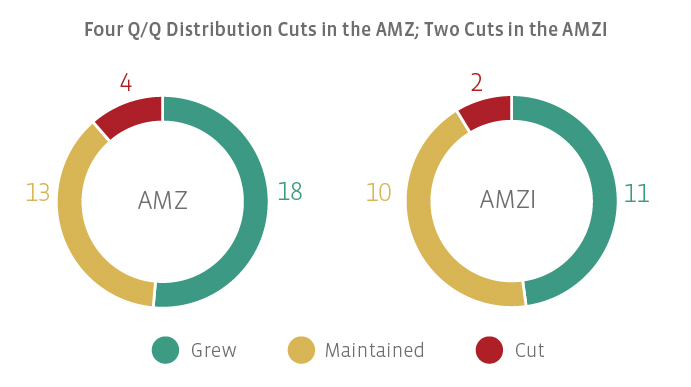
For the AMZ and AMZI, consolidations completed during the first quarter led to two backdoor distribution cuts, which is when the distribution is effectively cut for legacy holders of an acquired MLP due to the lower distribution paid by the surviving entity. Western Gas Equity Partners acquired Western Gas Partners, and the combined company was renamed Western Midstream Partners (WES). Western Gas Partners was the predecessor in the index. For the index and legacy holders of Western Gas Partners, the 1Q19 distribution from WES represented a 5.1% cut. Similarly, following a merger transaction, EnLink Midstream Partners was replaced in the index by EnLink Midstream LLC (ENLC), and ENLC’s 1Q19 distribution represented a 17.7% cut relative to EnLink Midstream Partners’ 4Q18 distribution.
The remaining two cuts among AMZ constituents came from Summit Midstream Partners (SMLP) and Martin Midstream Partners (MMLP), which had a combined weight in the AMZ of less than 1% as of the March quarterly rebalancing. In February, SMLP announced that it would cut its quarterly distribution by 50% to $0.2875 per unit as one element in a series of strategic actions that also included eliminating its IDRs. MMLP also announced that it would cut its distribution in half to $0.25 per unit per quarter as it focuses on strengthening its financial positioning.
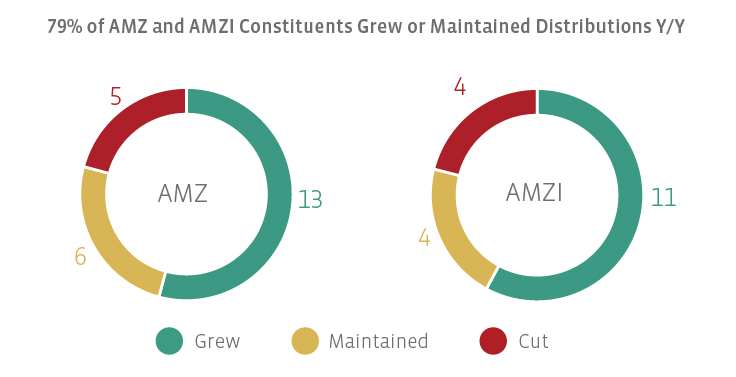
Most AMZ and AMZI constituents grew their distributions year-over-year.
The charts below compare the 1Q19 distribution with the 1Q18 distribution for those names that were in the index in both periods. Note that this approach introduces survivorship bias. As a result of the AMZ methodology change that became effective in December 2018, eleven tickers have been excluded from the year-over-year comparison for the AMZ since they were not in the index in 1Q18. Four tickers have been excluded from the AMZI. We included ENLC, WES, Tallgrass Energy (TGE), and Energy Transfer (ET) because they had a related predecessor in the indices in 1Q18.


AMZ constituents that maintained their distribution in 1Q19 relative to 1Q18 include (names with an asterisk are also in the AMZI):
Crestwood Equity Partners (CEQP)
DCP Midstream (DCP)
Enable Midstream Partners (ENBL)
NGL Energy Partners (NGL)
NuStar Energy (NS)
TC PipeLines (TCP)
Backdoor cuts from ET, ENLC, and WES account for three of the four cuts for the AMZI shown above, with the other cut coming from Buckeye Partners (BPL). On Friday, BPL announced that it agreed to be acquired by IFM Investors. BPL expects to pay a distribution in August, but an additional distribution will depend on the timing of the transaction’s close, which is expected in 4Q19. For the AMZ, the other cut is from SMLP, which was in the index for both periods (MMLP was not). Prior cuts from TC PipeLines (TCP) and NuStar Energy (NS) have rolled off from the year-over-year comparison.
Why may MLP distributions be in a better position going forward?
As we saw this quarter, distribution cuts can be a byproduct of consolidation transactions. Since the start of 2018, four of the six distribution cuts among AMZI constituents coincided with consolidation transactions (ET, ENLC, WES, NS). For ANDX holders, the acquisition by MPLX (MPLX) will result in a distribution cut, though this was expected given that ANDX had the highest yield among AMZI constituents as of April 30 at 12.3%. Based on company guidance, MPLX holders will see distribution growth of $0.01 per unit per quarter for 2019. For investors, the conclusion of MLP consolidations, which we believe have largely been announced at this point, may help stabilize distributions and set the stage for growth.
Distribution coverage, which compares distributable cash flow (DCF) to distributions paid, also continues to improve (read more). The average distribution coverage ratio for AMZI constituents for 1Q19 was 1.5x, excluding Cheniere Energy Partners (CQP), which does not report DCF, and NGL Energy Partners (NGL), which has not yet reported results. In other words, AMZI constituents on average are generating 50% more cash than they are paying out as distributions. Improving coverage indicates that MLPs are better able to afford their distributions, while also using retained cash flow to fund growth projects.
Among the large and mid-cap MLPs in the AMZI, the companies that needed to right-size their distributions have largely done so in our view. It is positive to see PAA, which had cut its distribution twice, return to growth having achieved its deleveraging target. While some MLPs will continue to prioritize debt reduction or growth capital over distribution increases, the combination of consolidations concluding and healthy distribution coverage has limited the risk of potential cuts, particularly among AMZI constituents.

