Historical Observations
- Correlations between MLPs and Utilities have weakened in recent years, and investors may need to be more selective.
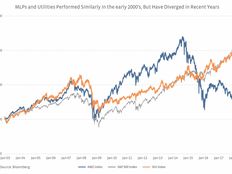
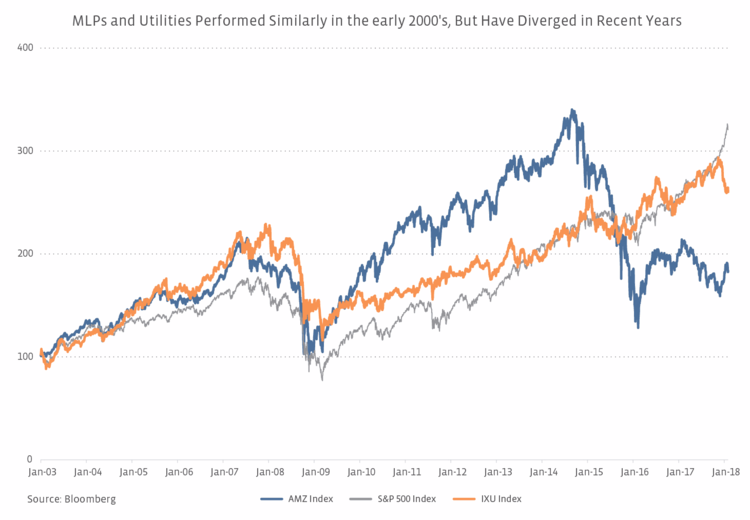
The correlation between the AMZ and IXU has varied over the last twenty years as shown below but has been as high as 0.69 in 2006. The 20-year weekly correlation is 0.46. However, the correlation has been much weaker the last few years, likely a function of the volatility in oil prices and the higher correlation between MLPs and oil as oil prices were falling. Utilities have generally performed well in the low-interest rate environment of recent years.
For the first time in twenty years, the AMZ and IXU exhibited a negative correlation for the calendar year in 2017. Given that MLPs and Utilities are often mentioned in the same breath as yield-focused, energy-related investments, the negative correlation in 2017 may be somewhat surprising. While correlations are backwards-looking, the lower correlation in recent years potentially highlights the need for investors to more carefully differentiate among their investments in MLPs and Utilities. It may also speak to the potential for pair trading between the two sectors.
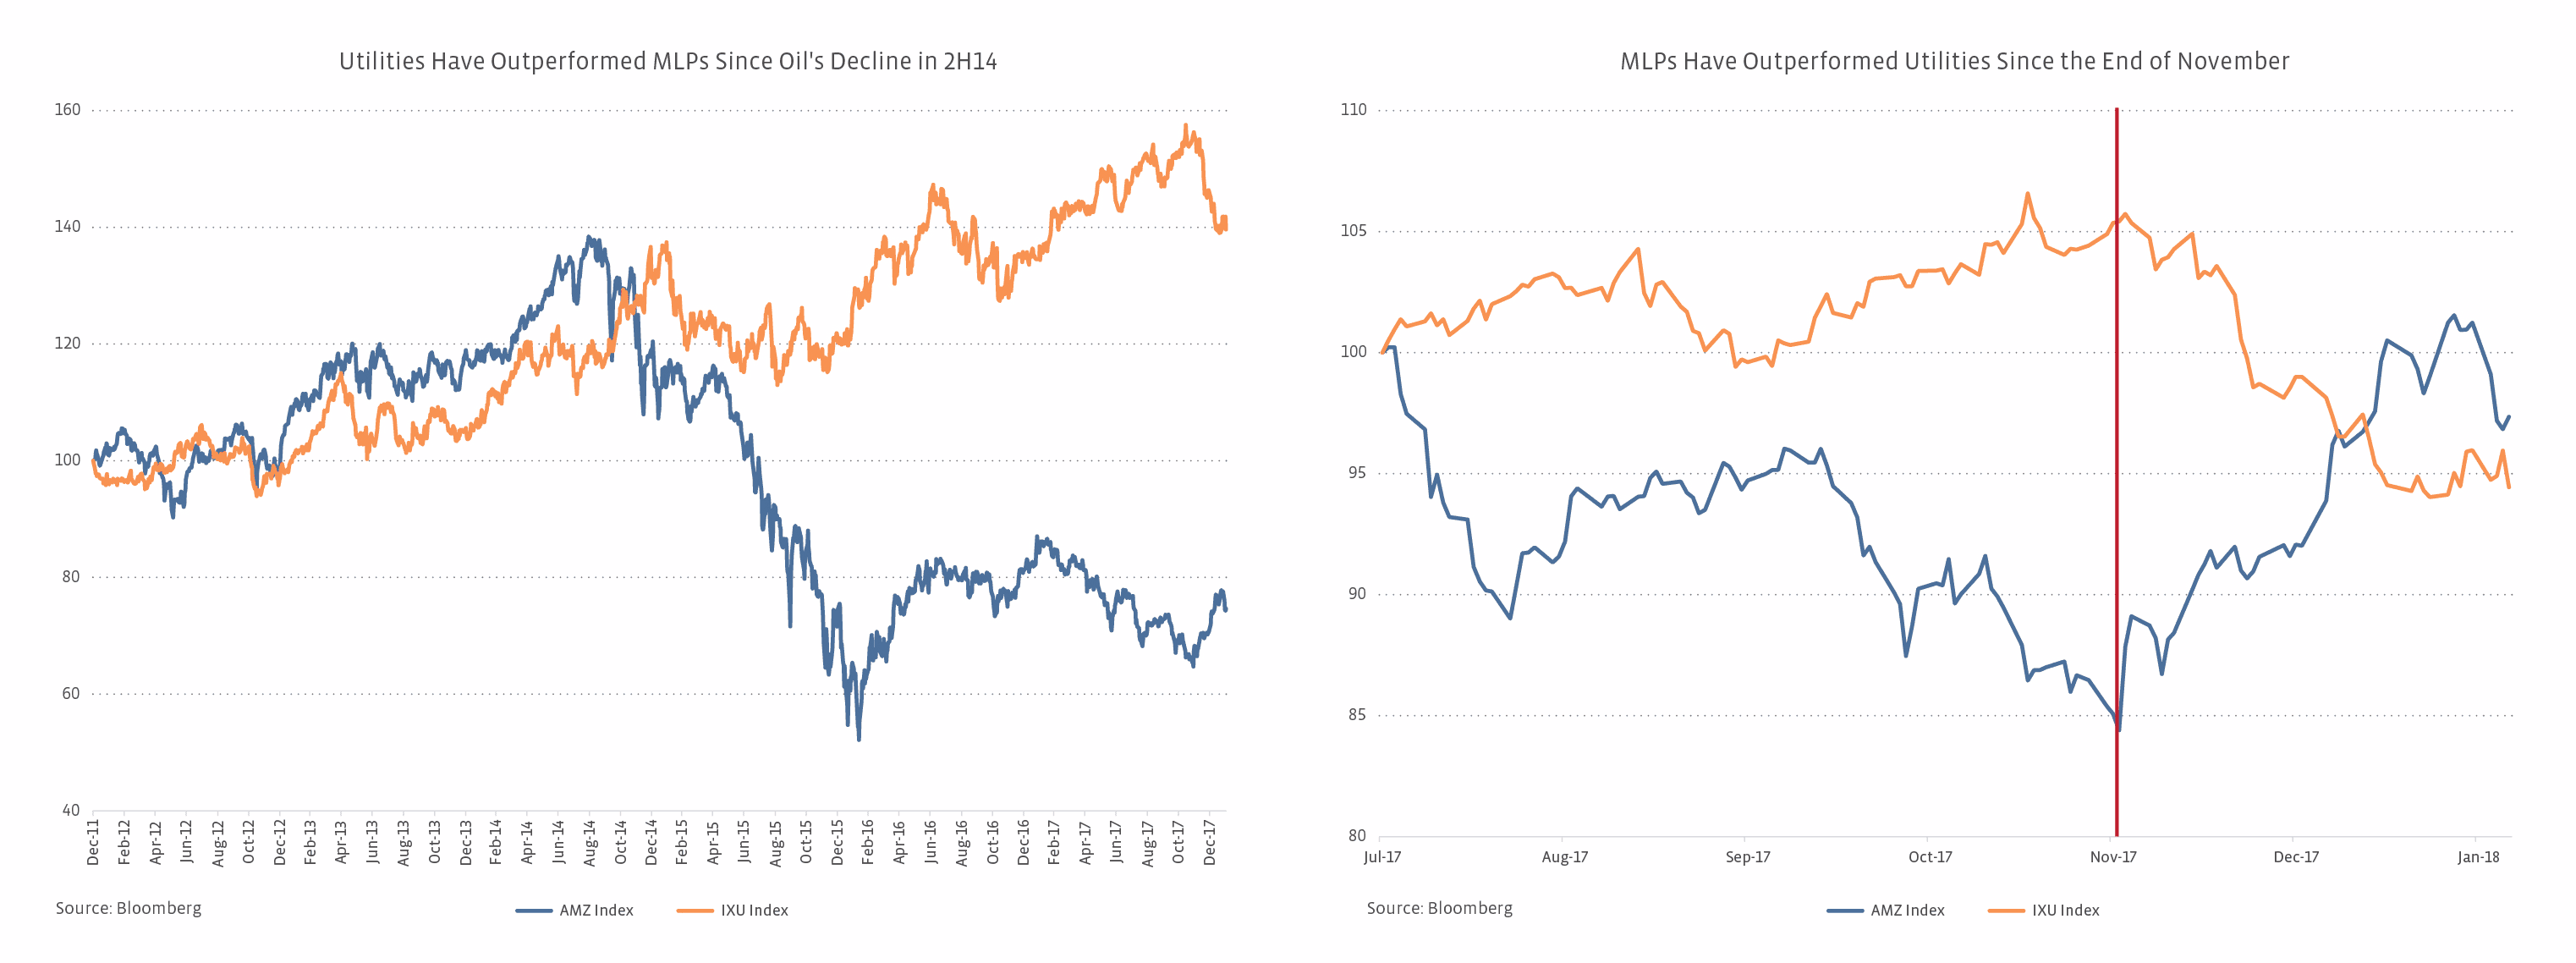
- Utilities have outperformed MLPs since the fall in oil prices in 2014 but have recently underperformed MLPs.
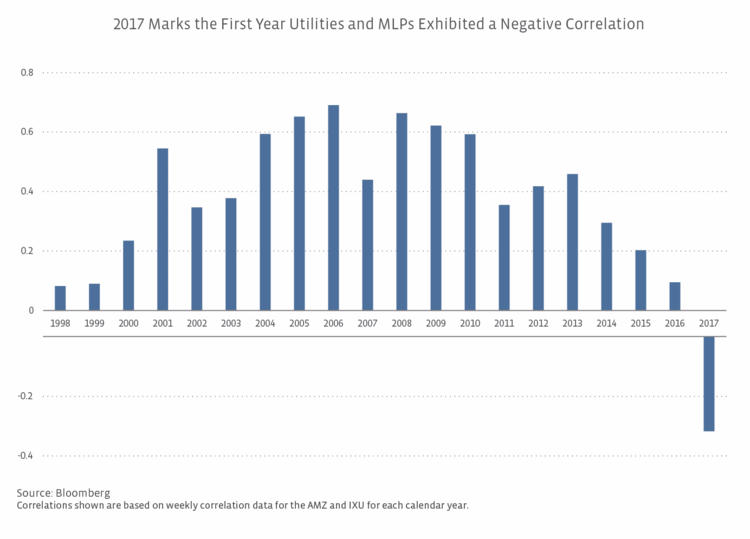
Utilities have handily outperformed MLPs since the second half of 2014, when oil prices started to nosedive. In 2017, the AMZ was down 13.0% compared to a gain of 8.3% for the IXU – both on a price-return basis. More recently, roles have reversed. From November 29, 2017 to February 2, 2018, MLPs have gained 11.9% while Utilities have fallen 11.1% on a price-return basis. Perhaps, investors are taking their gains in Utilities and shifting money from Utilities into MLPs with WTI oil prices currently sitting around $64 per barrel.
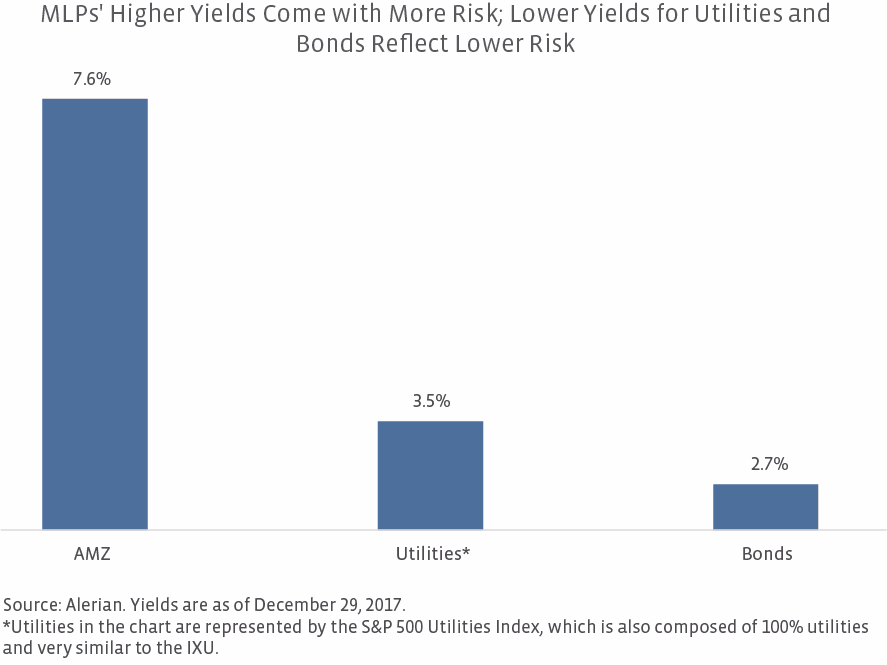
- MLPs offer better yields (and more risk).
On a total-return basis, the underperformance of MLPs relative to Utilities in 2017 was less severe, because MLPs have higher yields than Utilities. MLPs can offer more growth, but that tends to come with more volatility. Utilities’ lower yield reflects the lower risk of Utility stocks, which have a three-year beta of 0.12 compared to 1.18 for the AMZ. Utilities are known to be more stable, defensive investments. They are also larger companies in terms of market capitalization. The average market cap among the IXU was over $23.0 billion at year-end 2017 compared to the AMZ’s average market cap of just under $8.0 billion. The total market cap of the IXU Index was approximately $650 billion — more than twice the AMZ’s total market cap of $316 billion as of year-end 2017.

- If you’re optimistic on the economy and believe oil will remain somewhat stable in the $60-per-barrel range, advantage MLPs.
An environment with stable oil prices around $60 per barrel should be conducive for US oil and gas production growth, which is fundamentally positive for MLPs. Economic growth in the US and abroad supports demand for hydrocarbons and bodes well for MLPs, which are increasingly levered to global demand through exports.
- If you’re anticipating a global recession, advantage Utilities.
Utilities are broadly defensive and less volatile than MLPs. A global recession would likely have a negative impact on MLPs as hydrocarbon demand growth would slow and oil prices would potentially decline, leading to lower US production levels. If the US economy is suffering, it’s likely that interest rate increases will be moderated or tabled, removing that potential overhang on Utilities.
- If you think oil is going to fall back below $50 per barrel, advantage Utilities.
Oil markets have made progress toward rebalancing. Geopolitical concerns and production outages have helped support global oil prices. That said, the oil market can change rapidly. While no one can really predict future prices, if you believe oil prices are going to retrace significantly, Utilities are probably better positioned than MLPs, which demonstrated a higher correlation with oil when prices fell in the recent past.
- If you’re worried about interest rates rising, advantage MLPs.
The Federal Reserve previously forecasted three interest rate hikes in each of 2018 and 2019. Rising interest rates can be a headwind for both MLPs and Utilities in two ways — 1) bond investments become more attractive increasing competition for investor dollars among yield vehicles, and 2) borrowing costs rise. Historically, Utilities have been sensitive to rising interest rates. Utilities and Bonds characteristically have more in common (defensive, stable) than MLPs and Bonds. As such, Bonds represent more competition for Utilities than MLPs. MLPs are more likely insulated due to their higher yield (see chart above) and distribution growth, which helps offset the competition from rising bond yields. (See our white paper on MLPs’ response to rising interest rates.) While MLPs are no strangers to the debt market, Utilities generally carry more debt as a function of their greater capital intensity. Rate changes for regulated utilities are periodic but tend to lag changes in borrowing costs, which can squeeze Utilities’ profitability when rates are rising.
Though both can be labeled yield-oriented, energy-related equities, MLPS and Utilities have important differences that have become more pronounced in recent years as the correlation between MLPs and Utilities has deteriorated. Utilities have been the better bet since 2014, but the tide has recently turned, with MLPs outperforming Utilities by over 20 percentage points since late November. Perhaps, investors are already rotating out of Utilities into MLPs as they gain comfort with the current oil price environment. MLPs are off to a good start relative to Utilities in 2018. While one month does not make a year, it may make investors take a closer look at their allocations between MLPs and Utilities, especially in an environment of rising interest rates.

