ETFdb Logo
  • ETF Database
  • Content Hubs
    • Themes
      • Active ETF
      • Alternatives
      • Artificial Intelligence
      • China Insights
      • Core Strategies
      • Crypto
      • Disruptive Technology
      • Energy Infrastructure
      • ETF Building Blocks
      • ETF Investing
      • ETF Strategist
      • Financial Literacy
      • Fixed Income
      • Free Cash Flow
      • Future ETFs
      • Innovative ETFs
      • Institutional Income Strategies
      • Leveraged & Inverse
      • Market Insights
      • Market Outlooks
      • Modern Alpha
      • Nuclear Energy
      • Portfolio Strategies
      • Sector Investing
      • Tax Efficient Income
      • Thematic Investing
    • Asset Class
      • Equity
        • U.S. Equity
        • Int'l Developed
        • Emerging Market Equities
      • Alternatives
        • Gold/Silver/Critical Materials
        • Cryptocurrency
        • Currency
        • Volatility
      • Fixed Income
        • Investment Grade Corporates
        • US Treasuries & TIPS
        • High Yield Corporates
        • Int'l Fixed Income
    • ETF Ecosystem
    • ETFs in Canada
    • Market Outlook
    • Crypto ETF Hub
  • Tools
    • ETF Screener
    • ETF Country Exposure Tool
    • ETF Database Categories
    • Indexes
    • Scenario Analysis
    • Watchlists
    • Head-To-Head ETF Comparison Tool
    • Mutual Fund To ETF Converter
    • ETF Stock Exposure Tool
    • ETF Issuer Fund Flows
  • Research
    • ETF Education
    • Equity Investing
    • Dividend ETFs
    • Leveraged ETFs
    • Inverse ETFs
    • Index Education
    • Index Insights
    • Top ETF Sectors
    • Top ETF Issuers
    • Top ETF Industries
  • Webcasts
  • Sectors
    • Sector Investing Content Hub
    • XLK
    • XLI
    • XLU
    • XLY
    • XLP
    • XLRE
    • Sector Power Rankings
    • XLE
    • XLC
    • XLF
    • XLV
    • XLB
  • Multimedia
    • ETF 360 Video Series
    • ETF of the Week Podcast
    • Gaining Perspective Podcast
    • ETF Prime Podcast
    • Video
  • Company
    • About VettaFi
  • PRO
    • Pro Content
    • Pro Tools
    • Advanced
    • FAQ
    • Free sign up
    • Login
  1. Index Insights
  2. Alerian Explains: Emerge Energy Services
Index Insights
Share

Alerian Explains: Emerge Energy Services

Maria HalmoDec 11, 2014
2014-12-11

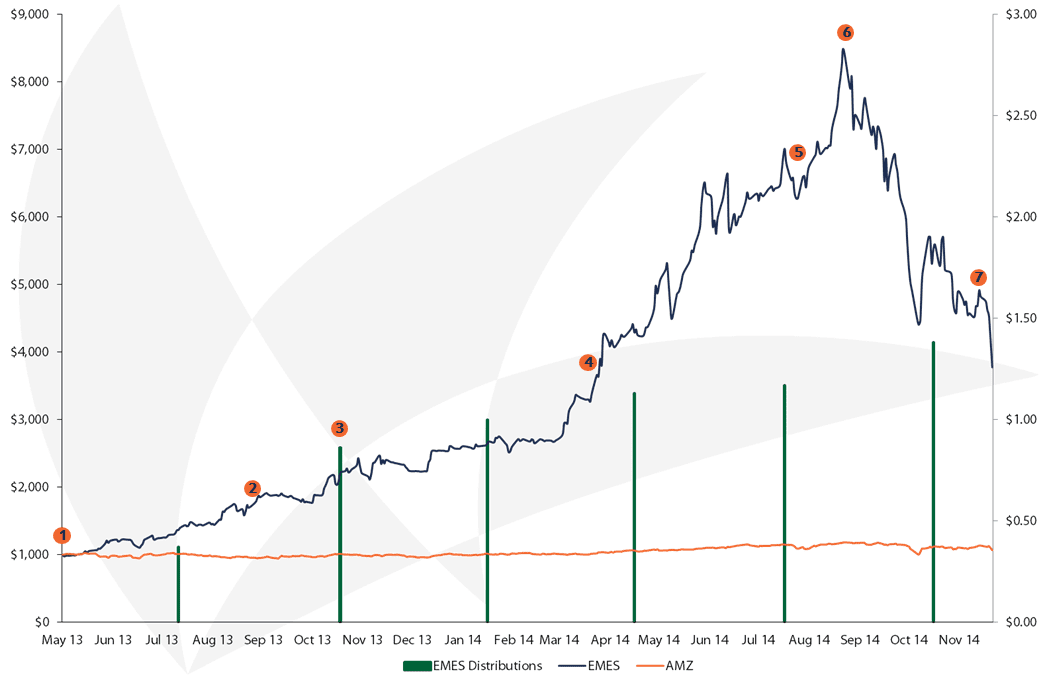
While not a traditional MLP, Emerge Energy Services (EMES) has caught the eye of many an MLP investor. If you take a close look at the chart below, it’s not hard to see why. That line at the bottom is the Alerian MLP Index (AMZ), which had respectable performance over the time period. EMES had it for lunch.

Unlike traditional MLPs, EMES is a variable distribution MLP, which means that it pays out all available cash flow every quarter without an intention to retain some portion for the purposes of long-term distribution stability. EMES is best known for its frac sand mining business, a vertically integrated value chain that extracts, washes, dries, and ships the sand for customers. I would be remiss not to mention that they also have a Fuel segment focused on the processing and sale of transmix.

To be frank, I will be able to point to little along the way that explains a nearly 800% increase in the stock price over 16 months followed by an equally steep dive. More buyers than sellers on the way up, and more sellers than buyers on the way down?

This is the image alt text


Content continues below advertisement

2014.12.12 Alerian Explains - EMES

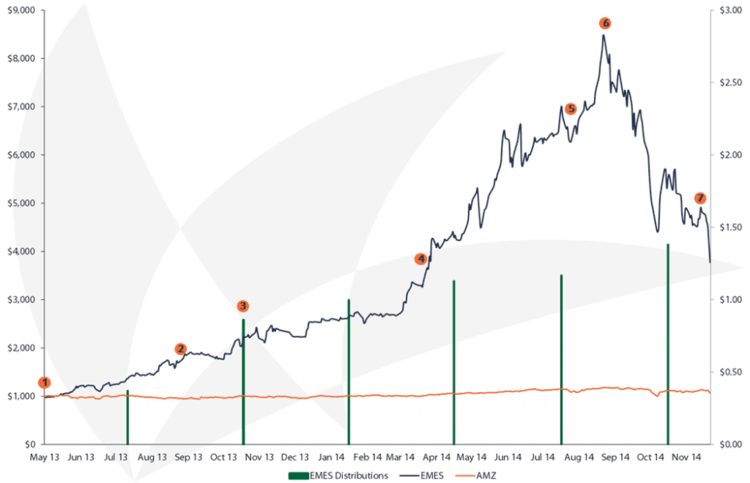
1. May 8, 2013. EMES prices IPO at $17. Initially the deal breaks, closing at $16.55 after the first day of trading. A month later on  June 10th, EMES closes at $20.79, a 25% increase over the low.

2. August 28, 2013. EMES issues 8-K. Management discloses expectations of continued strong frac sand pricing and an eventual annual distribution of $4 per unit, or 43% ahead of the prorated quarterly distribution paid earlier in the month. The next day, EMES closes at $29.48.

3. October 2013. EMES jumps another 24% during the month as investors expect the company to report strong third quarter results in November. When results are released on November 14th, they are better than already elevated expectations, and management suggests that the growth trajectory remains steep.

4. March 13, 2014. EMES reports 2013 results. Management commentary is appropriately very proud of the company’s 2013 achievements. Results exceeded not only analyst expectations, but management’s as well. Total volume of sand sold more than doubled, and income from their fuel segment increased sixfold.

5. August 6, 2014. EMES announces second quarter 2014 results. Another record quarter. Capacity at existing facilities is sold out, distribution guidance is increased to $4.70-$4.90 annually, and construction on expansion projects is underway. EMES closes at $113.08 on August 7th, an increase of 565% over the price at IPO.

6. August 29, 2014. EMES closes at an all-time high of $144.17, a 748% return for IPO buyers. Despite the steady decline in crude prices throughout the summer, demand for frac sand remains unaffected in the Permian and the Eagle Ford.

7. October 30, 2014. EMES announces third quarter 2014 results. Yet another record quarter. Margins continue to improve. New capacity is sold out at robust pricing shortly after coming online. Management issues guidance of $8.00 per unit in annual distributions. But investors begin worrying about the meteoric rise of EMES and the sustainability of frac sand pricing over the long-term in a steeply declining crude environment. A month later on November 28th, EMES closes at $64.15, a 56% decline from its all-time high, forcing sell-side analysts to slash price targets that had been as high as $166.

» Popular Pages

  • Tickers
  • Articles

Jun 22

World Markets Watchlist: June 22, 2026

Jun 22

Emerging Markets to Spike as Oil Prices Dip? Try GSEE

Jun 22

Look Beyond Market Euphoria After 3 FCF ETFs Rebalanced

Jun 22

Private Credit Offers Viable Yield Path as Rates Stay Elevated

Jun 22

Franklin Files for Bitcoin-Integrated Dividend ETFs

Jun 22

Managing Exposure to International Equity ETFs Amid UK Political Shifts

Jun 22

Physical AI & Global Reshoring Beyond the Humanoid Hype

Jun 22

VIDEO: ETF of the Week: VFLO

Jun 22

Gaming ETF GAMR Adds Arcade Gaming Giant to Portfolio

Jun 22

Weekly Economic Snapshot: A Hawkish Hold in a High-Stakes Market

QQQ

Invesco QQQ Trust Series I

VOO

Vanguard S&P 500 ETF

GLD

SPDR Gold Shares

PPLT

abrdn Physical Platinum...

SIVR

abrdn Physical Silver Shares...

FOTO

Tuttle Capital Pure Play...

SMH

VanEck Semiconductor ETF

DRAM

Roundhill Memory ETF

SCHD

Schwab US Dividend Equity ETF...

IVV

iShares Core S&P 500 ETF

Loading Articles...

Advertisement

Is Your Portfolio Positioned With Enough Global Exposure?

ETF Education Channel

How to Allocate Commodities in Portfolios

Tom LydonApr 26, 2022
2022-04-26

A long-running debate in asset allocation circles is how much of a portfolio an investor should...

Core Strategies Channel

Why ETFs Experience Limit Up/Down Protections

Karrie GordonMay 13, 2022
2022-05-13

In a digital age where information moves in milliseconds and millions of participants can transact...

}
X