ETFdb Logo
ETFdb Logo
  • ETF Database
  • Channels
    • Themes
      • Active ETF
      • Artificial Intelligence
      • Beyond Basic Beta
      • China Insights
      • Climate Insights
      • Core Strategies
      • Crypto
      • Direct Indexing
      • Disruptive Technology
      • Energy Infrastructure
      • ETF Building Blocks
      • ETF Investing
      • ETF Education
      • ETF Strategist
      • Financial Literacy
      • Fixed Income
      • Free Cash Flow
      • Innovative ETFs
      • Institutional Income Strategies
      • Leveraged & Inverse
      • Managed Futures
      • Market Insights
      • Modern Alpha
      • Multifactor
      • Responsible Investing
      • Retirement Income
      • Tax Efficient Income
    • Asset Class
      • Equity
        • U.S. Equity
        • Int'l Developed
        • Emerging Market Equities
      • Alternatives
        • Commodities
        • Gold/Silver/Critical Minerals
        • Currency
        • Volatility
      • Fixed Income
        • Investment Grade Corporates
        • US Treasuries & TIPS
        • High Yield Corporates
        • Int'l Fixed Income
    • ETF Ecosystem
    • ETFs in Canada
  • Tools
    • ETF Screener
    • ETF Country Exposure Tool
    • ETF Sector Tracker Tool
    • ETF Database Categories
    • Head-To-Head ETF Comparison Tool
    • ETF Stock Exposure Tool
    • ETF Issuer Fund Flows
    • Indexes
    • Mutual Fund To ETF Converter
  • Research
    • ETF Education
    • Equity Investing
    • Dividend ETFs
    • Leveraged ETFs
    • Inverse ETFs
    • Index Education
    • Index Insights
    • Top ETF Sectors
    • Top ETF Issuers
    • Top ETF Industries
  • Webcasts
  • Themes
    • AI ETFs
    • Blockchain ETFs
    • See all Thematic Investing ETF themes
    • ESG Investing
    • Marijuana ETFs
  • Multimedia
    • ETF 360 Video Series
    • ETF of the Week Podcast
    • ETF Prime Podcast
    • Video
  • Company
    • About VettaFi
    • Get VettaFi’ed
  • PRO
    • Pro Content
    • Pro Tools
    • Advanced
    • FAQ
    • Pricing
    • Free Sign Up
    • Login
  1. Index Insights
  2. An Introduction to Alerian’s Midstream Dividend Indexes
Index Insights
Share

An Introduction to Alerian's Midstream Dividend Indexes

Caroline MahavierMar 03, 2020
2020-03-03

The Alerian Midstream Energy Dividend Index (AEDW) and the Alerian MLP Infrastructure Dividend Index (AMDW) are two fundamentally-weighted indexes based on the liquid, dividend-paying portion of the North American energy infrastructure universe. AEDW includes both midstream MLPs and North American C-Corporations, while AMDW only includes midstream MLPs. This piece will provide an introduction to the new indexes and the implications of weighting by dividend payments rather than the more traditional weighting by market capitalization.

Introducing Alerian’s midstream dividend indexes
The Alerian Midstream Energy Dividend Index (AEDW) and Alerian MLP Infrastructure Dividend Index (AMDW) are fundamentally-weighted indexes, meaning that constituents are selected and weighted based on a fundamental equity valuation criterion. While AEDW and AMDW are weighted by dividend payments, other common fundamental-weighting methodologies may include revenues, free cash flow, or book value.

The process of weighting fundamentally by dividend payments is straightforward. Each company’s total distribution is calculated as shares outstanding multiplied by its annualized dividend based on the most recent dividend. Each constituent’s weight is then calculated by taking its total distribution and dividing by the sum of all index constituent distributions. Finally, a 10% cap is applied to constituent weights. Simply put, companies that pay out more cash flow per share are weighted higher relative to peers that distribute less.

While their weighting scheme is unique among Alerian indexes, AEDW and AMDW share similar constituent universes with the Alerian Midstream Energy Index (AMNA) and the Alerian MLP Infrastructure Index (AMZI). The table below compares AEDW with AMNA and AMDW with AMZI. Note that the comparisons contain backtested data. Unlike AMNA, AMZI, and the rest of Alerian’s index suite, it is important to note that AEDW and AMDW are rebalanced quarterly and reconstituted annually. Quarterly rebalancings occur in January, April, July, and October, with only the weightings of constituents adjusted. Excluding spin-offs, companies can only be added to AMDW or AEDW during the annual reconstitution in October. However, constituents can be removed from the index between reconstitutions due to special situations such as mergers, acquisitions, or bankruptcies.

This is the image alt text

The dividend-weighted indexes outperform in the long-term despite overlap
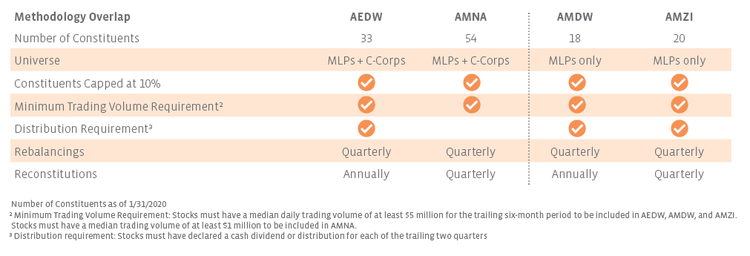
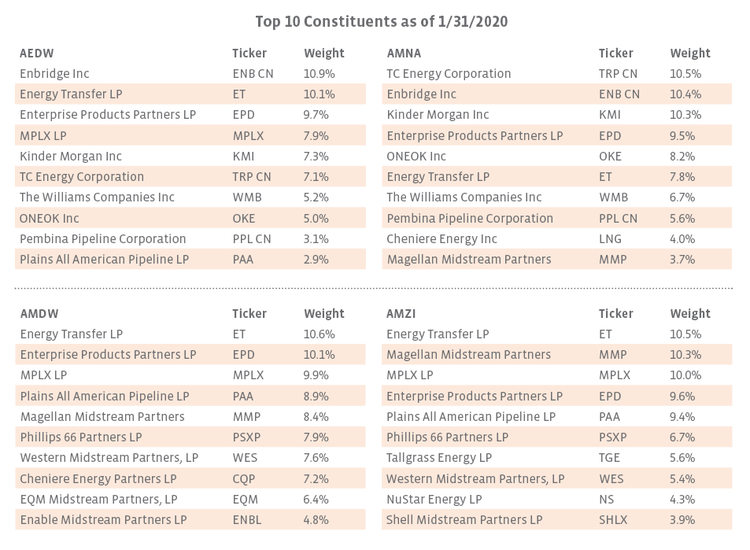
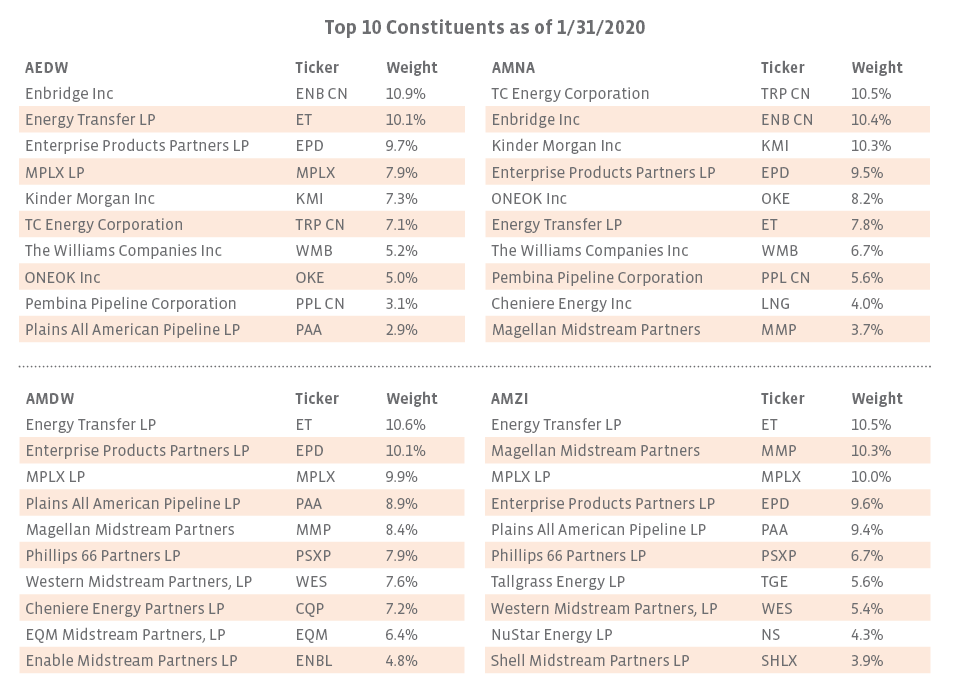
As reflected in the Methodology Overlap table above, AEDW/AMNA and AMDW/AMZI clearly have similar characteristics. As of January 31, 2020, AEDW and AMNA had an overlap of 77.4% by weighting. AMDW and AMZI had an overlap of 81.1%. This overlap is further evident in the comparison of top ten holdings below. Cheniere Energy (LNG), which currently does not pay a dividend, is the only top ten AMNA constituent not included in AEDW’s top ten, while AMDW and AMZI share seven top ten holdings.


Content continues below advertisement

This is the image alt text

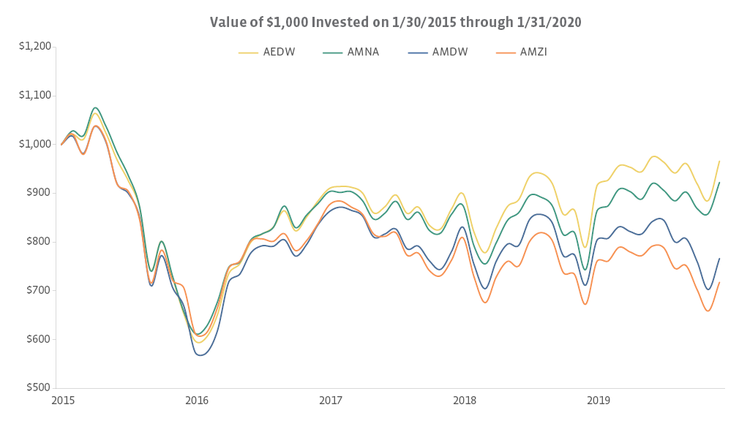
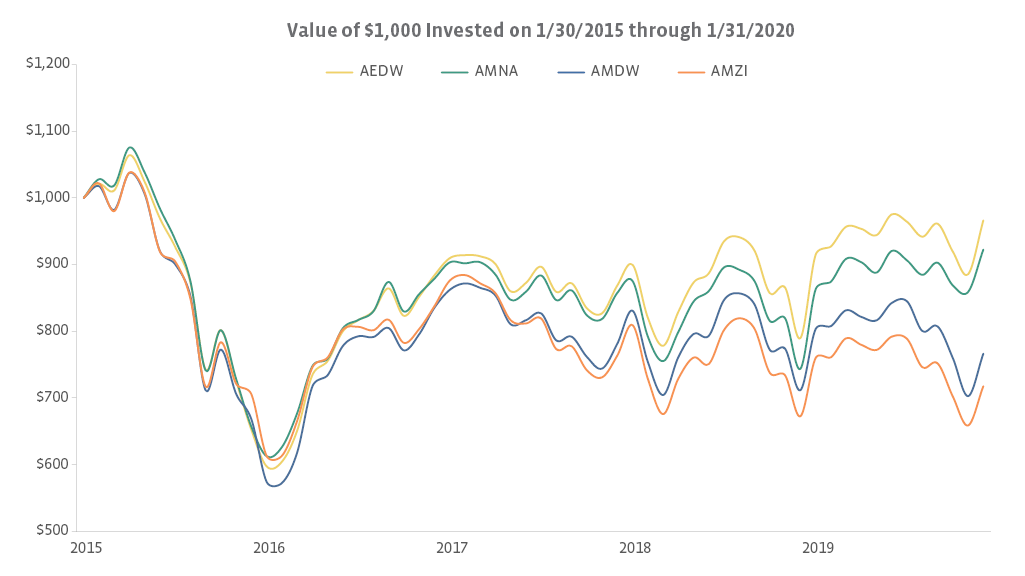
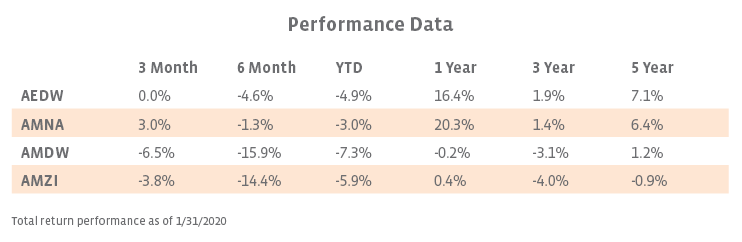
Given the significant overlap, one may expect similar performance between the fundamentally-weighted and market capitalization-weighted indexes. However, depending on the period, performance differences have been somewhat significant (see chart and table below). AEDW and AMDW have outperformed AMNA and AMZI, respectively, in the long-term. However, in the recent periods, AMZI and AMNA have performed better than their dividend-weighted counterparts. This performance difference alludes to the statistics that will be covered in the following section – among them, AEDW and AMDW have higher standard deviations, reflecting more volatility.

This is the image alt text

This is the image alt text

Dividend-weighted indexes have generated higher risk-adjusted returns
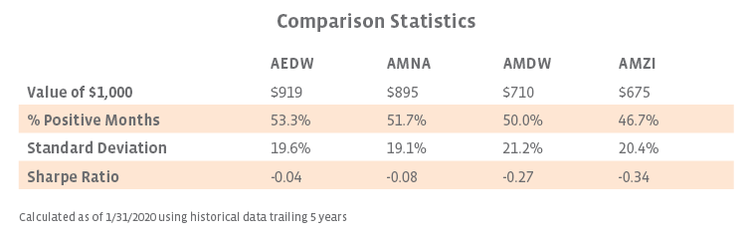
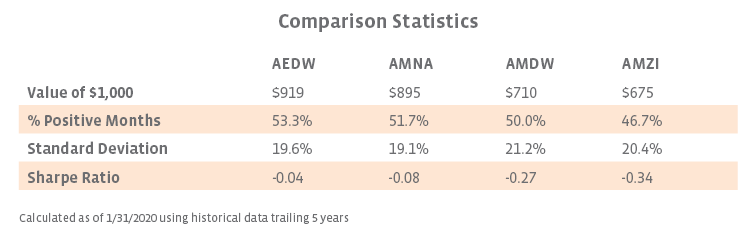
To better evaluate the risk-return profile of AEDW and AMDW relative to AMNA and AMZI, it is informative to look at the metrics in the table below. Based on standard deviations alone, the dividend-weighted indexes suggest more risk than their capitalization-weighted peers. However, despite having a higher standard deviation, AEDW and AMDW generated higher risk-adjusted returns over the five-year analysis period as evidenced by their Sharpe ratios displayed in the table below. Even though AEDW’s standard deviation is 0.5% greater than AMNA’s, its Sharpe ratio is higher by 0.04. AMDW’s standard deviation is 0.8% higher than AMZI’s and its Sharpe ratio is 0.07 higher.

This is the image alt text

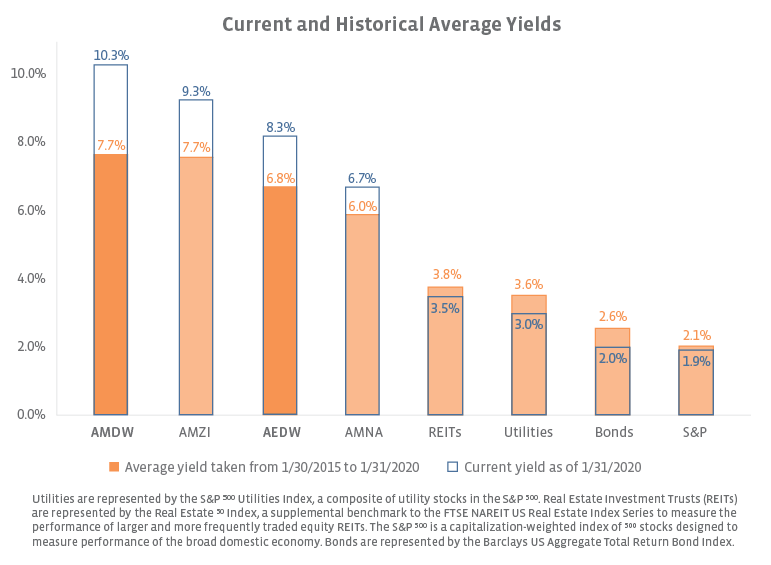
Dividend-weighted indexes screen attractively for yield
Compared to their capitalization-weighted counterparts, the dividend-weighted strategies also screen more attractively in terms of yield as shown below. The midstream MLP space is known for its steady cash flows and tax-advantaged distributions, which may lend itself to an indexing strategy that emphasizes the total dividend payout of its constituents.

This is the image alt text

While these strategies emphasize dividends, it is important to not view yield in a vacuum. Large swings in equity prices can quickly inflate yields. Capitalization-weighted indexes rely on the theory that market capitalization is the best measure of a company’s value. As the price rises, so does the company’s weighting in a capitalization-weighted index. Weighting by total distribution (dividend multiplied by shares outstanding) does not take into account price; instead it deems a company’s ability to pay out distributions as more deterministic of its long-term value.

Bottom line
The addition of AEDW and AMDW to the Alerian index suite provides stakeholders with new benchmarking tools and an index strategy based on dividends. Although they have historically carried slightly higher risk than their market capitalization-weighted counterparts, AEDW and AMDW have delivered higher long-term returns, higher long-term Sharpe ratios, and higher average yields.

» Popular Pages

  • Tickers
  • Articles

Sep 27

2 Signs of Stock Market Strength, Courtesy of the Bond Market

Sep 27

Bull vs Bear: Is the Best Equity Opportunity in SMIDcaps?  

Sep 27

Use International Multifactor ETFs to Diversify Portfolios

Sep 27

Buy on the Dip Prospects: September 27 Edition

Sep 27

Crypto: Bitcoin Unchanged From Last Week

Sep 27

Changing Forces

Sep 27

2 Active ETFs to Help Shield Against Volatility

Sep 27

Evaluating Links Between DEI and Investment Returns

Sep 27

Getting a Pulse on Preferred Stocks

Sep 27

Why Investors Are Gravitating Toward Active Management In 2023

QQQ

Invesco QQQ Trust Series I

SPY

SPDR S&P 500 ETF Trust

VOO

Vanguard S&P 500 ETF

XLK

Technology Select Sector SPDR...

JEPI

JPMorgan Equity Premium...

SMH

VanEck Semiconductor ETF

TLT

iShares 20+ Year Treasury...

VGT

Vanguard Information...

VTI

Vanguard Total Stock Market...

SCHD

Schwab US Dividend Equity ETF...

Loading Articles...
Our Sites
  • VettaFi
  • Advisor Perspectives
  • ETF Trends
Tools
  • ETF Screener
  • Mutual Fund to ETF Converter
  • Head-To-Head ETF Comparison
  • ETF Country Exposure Tool
  • ETF Stock Exposure Tool
  • ETF Database Pro
More Tools
  • Financial Advisor & RIA Center
Explore ETFs
  • ETF News
  • ETF Category Reports
  • Premium Articles
  • Alphabetical Listing of ETFs
  • Browse ETFs by ETF Database Category
  • Browse ETFs by Index
  • Browse ETFs by Issuer
  • Compare ETFs
Information
  • Contact Us
  • Terms of Use and Privacy Policy
  • © 2023 VettaFi LLC. All rights reserved.

Advertisement

Is Your Portfolio Positioned With Enough Global Exposure?

ETF Education Channel

How to Allocate Commodities in Portfolios

Tom LydonApr 26, 2022
2022-04-26

A long-running debate in asset allocation circles is how much of a portfolio an investor should...

Core Strategies Channel

Why ETFs Experience Limit Up/Down Protections

Karrie GordonMay 13, 2022
2022-05-13

In a digital age where information moves in milliseconds and millions of participants can transact...

}
X