ETFdb Logo
ETFdb Logo
  • ETF Database
  • Channels
    • Themes
      • Active ETF
      • Artificial Intelligence
      • Beyond Basic Beta
      • China Insights
      • Climate Insights
      • Core Strategies
      • Crypto
      • Direct Indexing
      • Disruptive Technology
      • Energy Infrastructure
      • ETF Building Blocks
      • ETF Investing
      • ETF Education
      • ETF Strategist
      • Financial Literacy
      • Fixed Income
      • Free Cash Flow
      • Innovative ETFs
      • Institutional Income Strategies
      • Leveraged & Inverse
      • Managed Futures
      • Market Insights
      • Modern Alpha
      • Multifactor
      • Responsible Investing
      • Retirement Income
      • Tax Efficient Income
    • Asset Class
      • Equity
        • U.S. Equity
        • Int'l Developed
        • Emerging Market Equities
      • Alternatives
        • Commodities
        • Gold/Silver/Critical Minerals
        • Currency
        • Volatility
      • Fixed Income
        • Investment Grade Corporates
        • US Treasuries & TIPS
        • High Yield Corporates
        • Int'l Fixed Income
    • ETF Ecosystem
    • ETFs in Canada
  • Tools
    • ETF Screener
    • ETF Country Exposure Tool
    • ETF Sector Tracker Tool
    • ETF Database Categories
    • Head-To-Head ETF Comparison Tool
    • ETF Stock Exposure Tool
    • ETF Issuer Fund Flows
    • Indexes
    • Mutual Fund To ETF Converter
  • Research
    • ETF Education
    • Equity Investing
    • Dividend ETFs
    • Leveraged ETFs
    • Inverse ETFs
    • Index Education
    • Index Insights
    • Top ETF Sectors
    • Top ETF Issuers
    • Top ETF Industries
  • Webcasts
  • Themes
    • AI ETFs
    • Blockchain ETFs
    • See all Thematic Investing ETF themes
    • ESG Investing
    • Marijuana ETFs
  • Multimedia
    • ETF 360 Video Series
    • ETF of the Week Podcast
    • ETF Prime Podcast
    • Video
  • Company
    • About VettaFi
    • Get VettaFi’ed
  • PRO
    • Pro Content
    • Pro Tools
    • Advanced
    • FAQ
    • Pricing
    • Free Sign Up
    • Login
  1. Index Insights
  2. Are MLPs Really Disappearing?
Index Insights
Share

Are MLPs Really Disappearing?

Stacey Morris, CFAApr 23, 2018
2018-04-23

There’s a common impression (dare we say, misconception?) in the MLP space that MLPs are becoming endangered species — in other words, that MLPs are on a path to extinction. Yes, there have been restructuring announcements and conversions to C Corporations, and certainly, the space is evolving. We will probably see more restructurings of MLPs that result in a conversion to a C-Corp structure. That said, it’s probably premature to make the call that we are going to see a wholesale abandonment of the MLP model.

In this post, we look at the actual makeup of the midstream universe, which is still biased in favor of K-1 issuers. We also compare yield and performance of MLPs and C Corporations and provide helpful context for investors weighing their different energy infrastructure investment options.

What does the midstream universe actually look like?

We focus on the midstream universe simply because most investors associate MLPs with midstream, though there are obviously other MLP business models. We define midstream companies as those entities involved in storage, transportation, and processing. Midstream excludes companies such as Viper Energy Partners (VNOM) — a mineral interest MLP that announced in March that it would change its tax status to become a taxable entity. Midstream also excludes Archrock Partners (APLP), a compression MLP that is being acquired by its C-Corp parent.

Before we dive in to the midstream landscape, for this discussion we break the universe into K-1 Issuers and 1099 issuers. For reference, K-1-issuing general partners such as Energy Transfer Equity (ETE) and EQT GP Holdings (EQGP) are included as K-1 issuers.

While the space is evolving, K-1 Issuers continue to represent the bulk of the midstream universe as shown in the infographic below. Setting aside 11 Canadian midstream companies and focusing strictly on the US, K-1 issuers represent 77% (50/65) of US midstream securities (excludes preferred units).

This is the image alt text

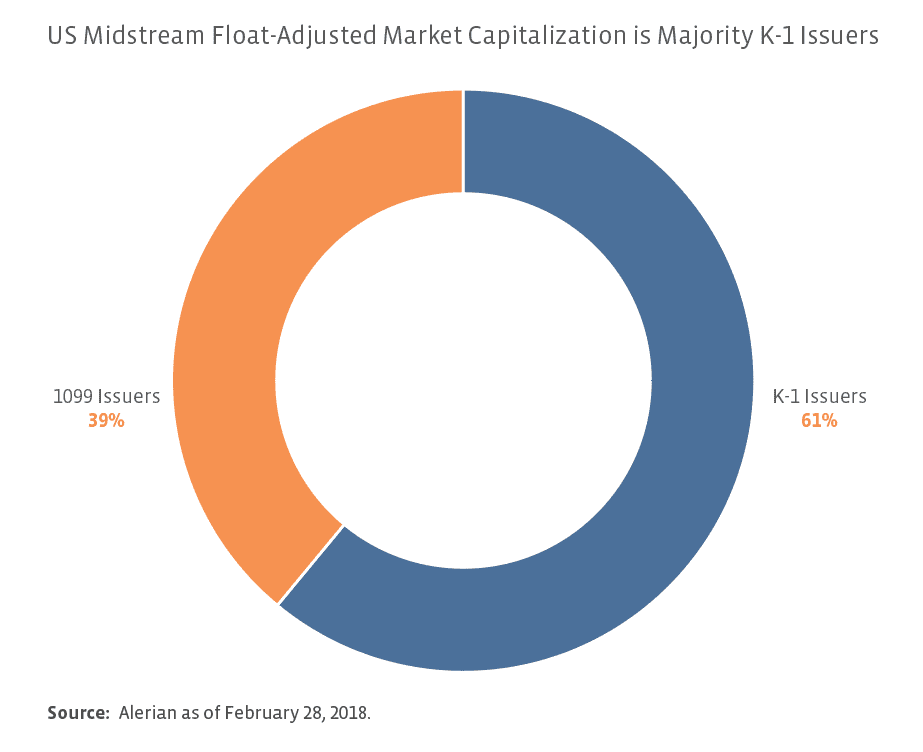
If you look at float-adjusted market capitalization as of the end of February, K-1 issuers represent 61% of the total US midstream float-adjusted market cap, with 1099 issuers representing the remaining 39%. Notably, just three corporations — Kinder Morgan (KMI), ONEOK (OKE) and Williams Companies (WMB) — constitute 26% of the total US midstream float-adjusted market capitalization.


Content continues below advertisement

This is the image alt text

What about those midstream companies that issue 1099s? Is the grass greener as a corporation?

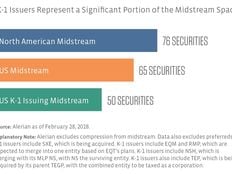
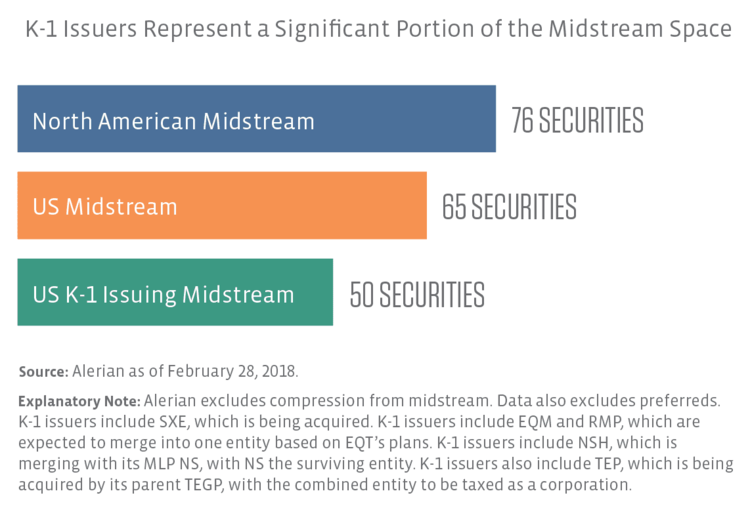
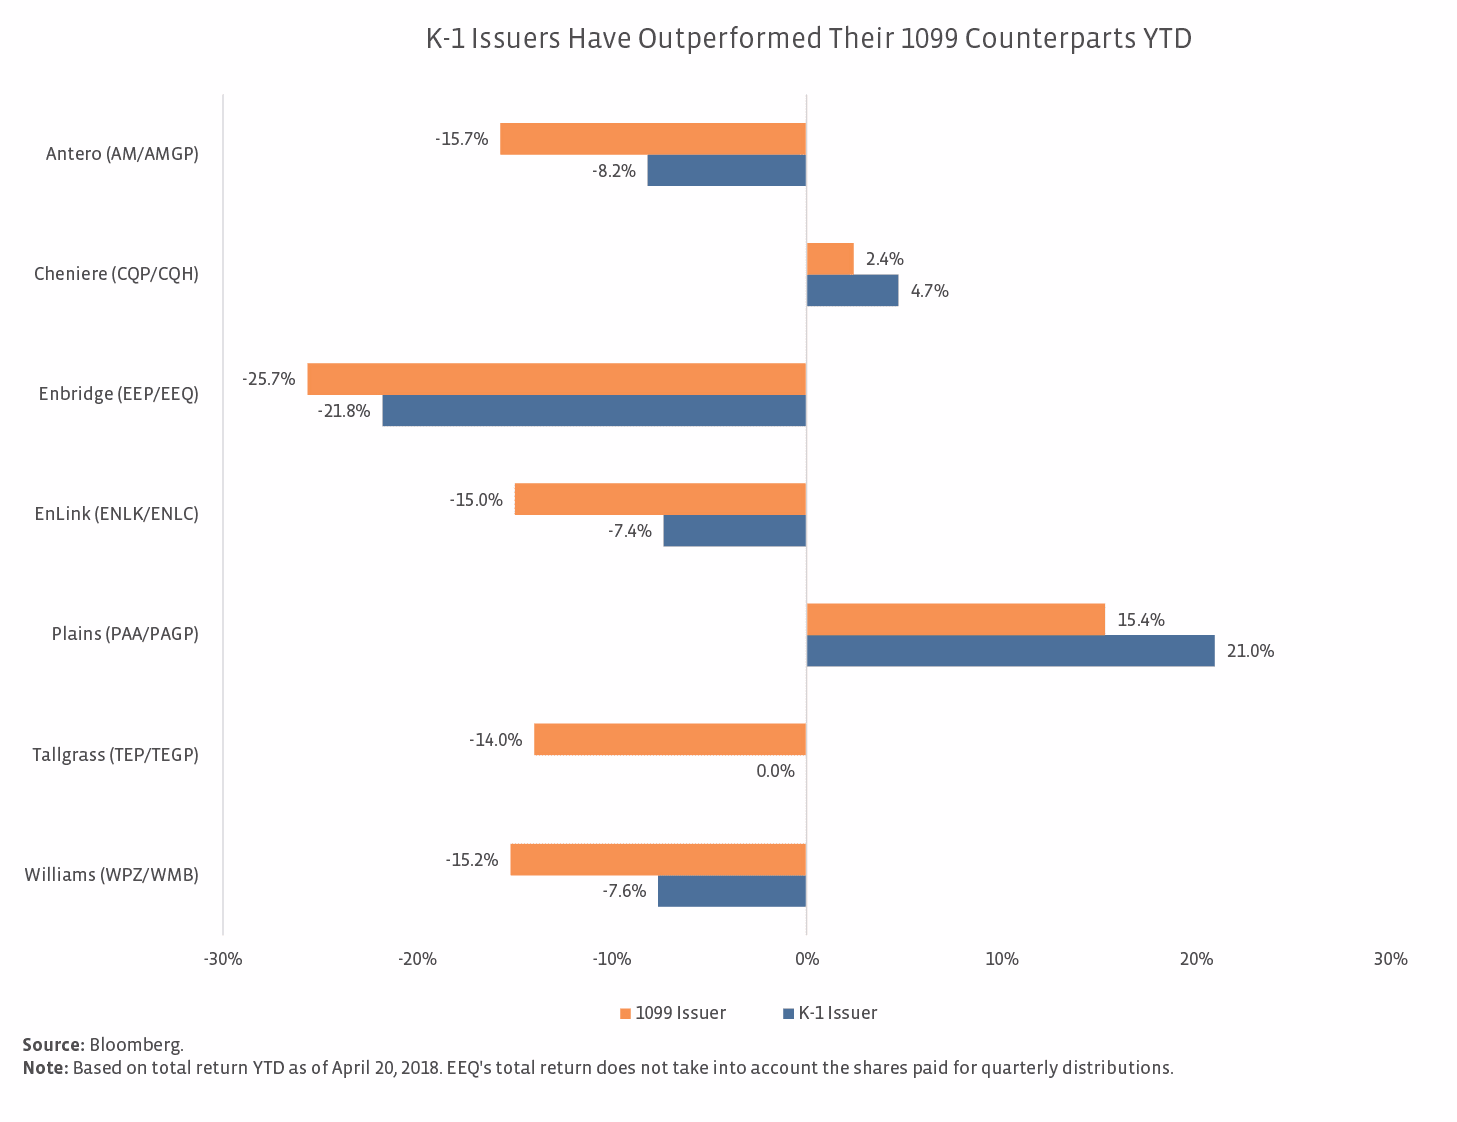
Let’s take a closer look at those 15 securities that are US midstream companies but are not K-1 issuers. Of those 15 securities, eight share an asset base with a K-1 issuer. This allows us to compare the yields and total return of the two related entities. For the Cheniere complex, we compare Cheniere Energy Partners LP Holdings (CQH) and Cheniere Energy Partners LP (CQP) below, though Cheniere Energy (LNG) is also affiliated. LNG does not pay a dividend. As you can see from the charts below, the K-1 issuers have outperformed their 1099-issuing counterparts year-to-date, which may be a surprise.

This is the image alt text

However, the performance is more mixed when looking at the total return for 2017.

This is the image alt text

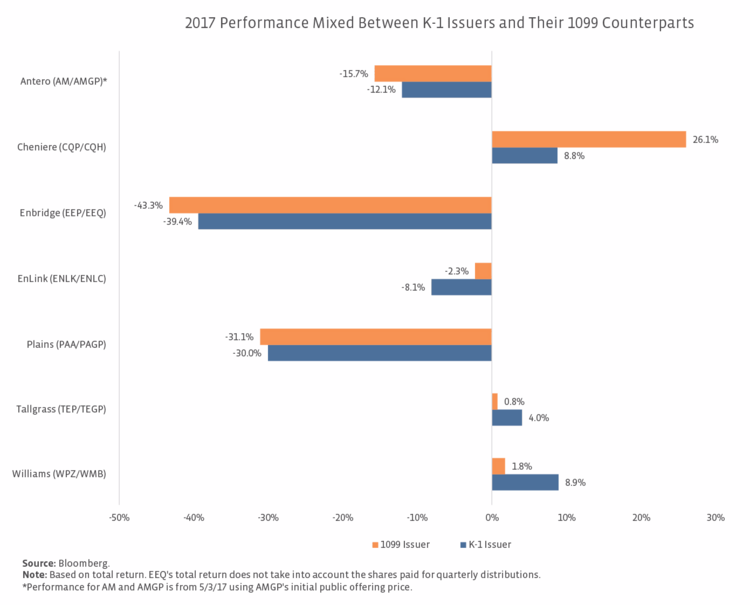
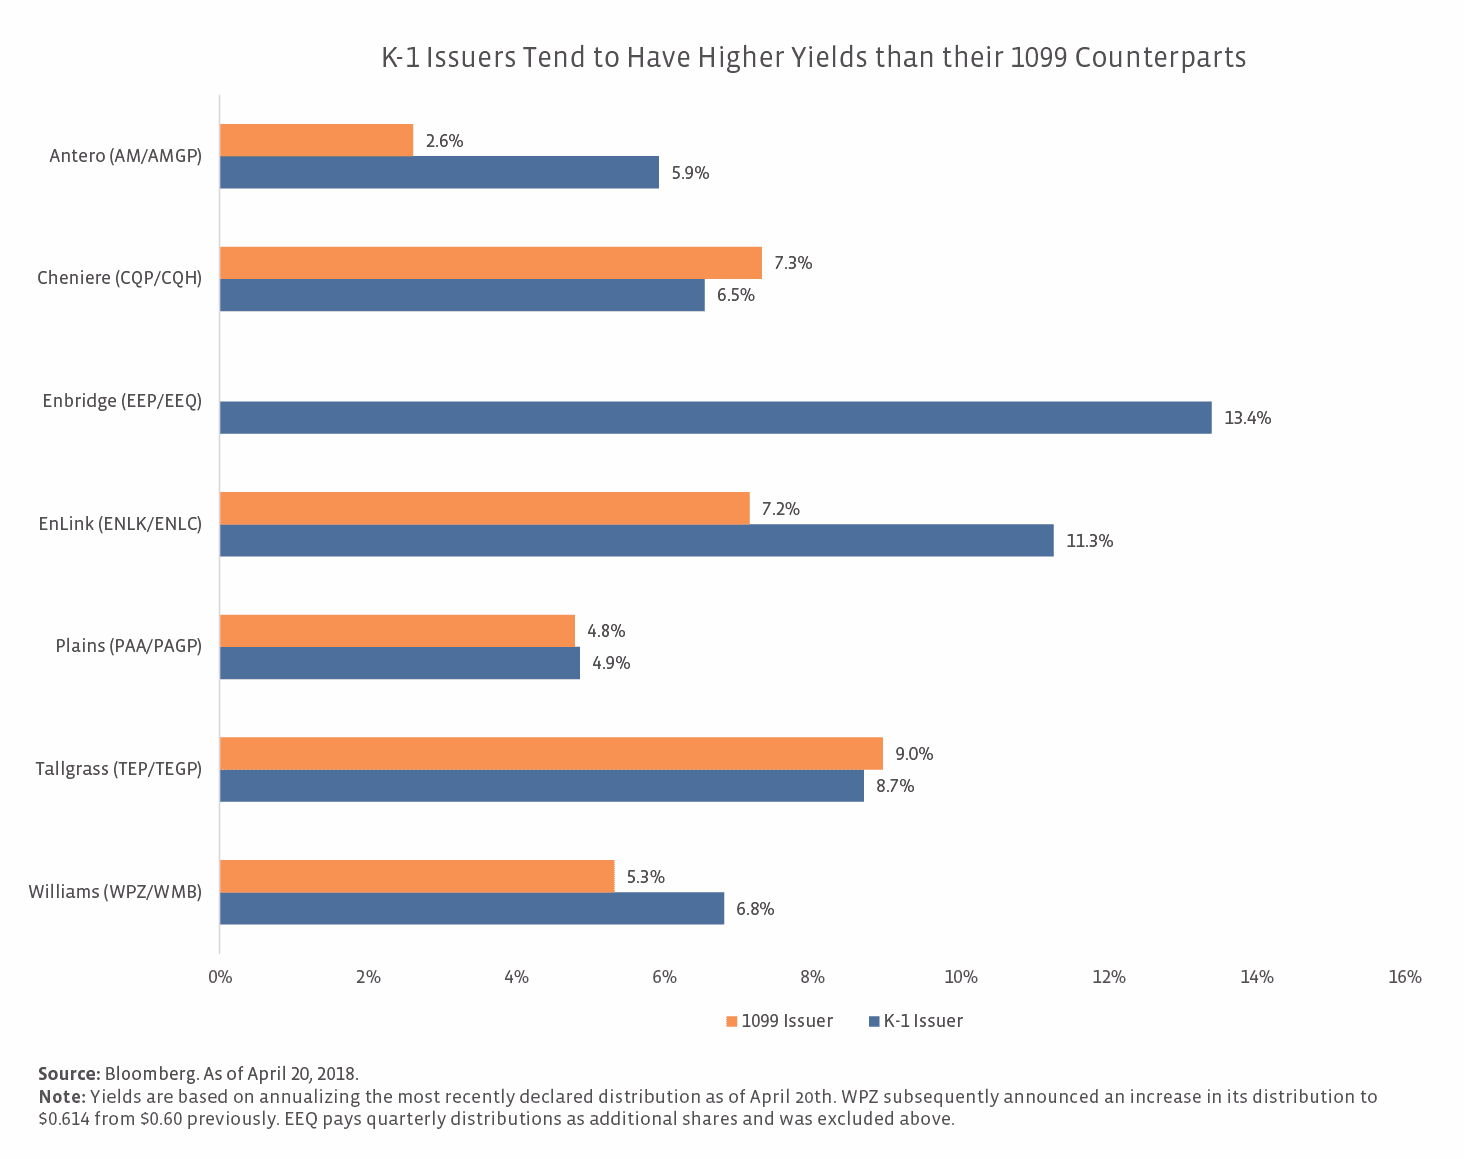
Typically, one would expect the K-1 issuer to have a higher yield given that it doesn’t pay tax at the entity level. Interestingly, in two of the seven pairings below, the 1099 issuer has a higher yield than its K-1 issuing counterpart. We chose to look at total return to even the playing field and because some of the 1099 issuers also have significant yields.

This is the image alt text

What about the seven other securities without a K-1 issuing affiliate? The seven include Tellurian (TELL) and NextDecade (NEXT), which are both focused on LNG export development and do not pay dividends, as well as Macquarie Infrastructure Corp. (MIC), Targa Resources (TRGP), SemGroup (SEMG), KMI and OKE. Setting aside TELL and NEXT, the average yield of the five remaining C-Corps was 7.2% (6.4% excluding MIC) as of April 20th. For context, the yield of the Alerian MLP Infrastructure Index (AMZI), which is a composite of energy infrastructure MLPs, was 8.2%. On a total-return basis, OKE and TRGP have outperformed the AMZI year-to-date through April 20th, while KMI, SEMG and MIC have underperformed. There seems to be an impression that the grass is greener for energy infrastructure corporations, but the data doesn’t fully support that sentiment.

“What’ll Ya Have?”

This is the greeting that meets you when you visit The Varsity — a fast food institution in downtown Atlanta. While Alerian can’t offer you delicious onion rings, we do want to help you get what you want as an energy infrastructure investor. We’re an indexing firm. We’re not in the business of giving investment advice. Our goal is to help investors make informed decisions when investing in MLPs or energy infrastructure. As such, we aren’t trying to say C Corporations are bad or that MLPs are good or vice versa. Instead, we want to point out the trade-offs that you should consider before investing in an individual midstream MLP, an energy infrastructure corporation, or an access product.

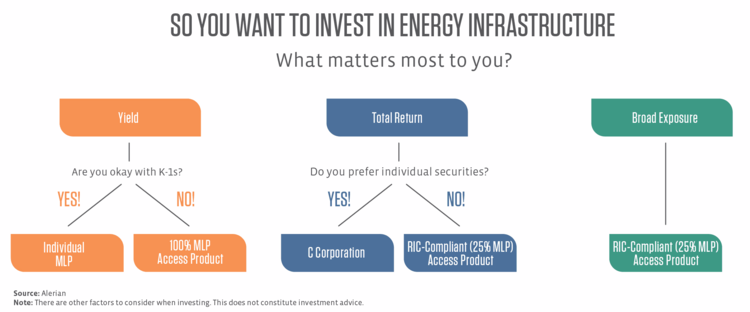
While there are lots of pros and cons to consider, we have a very simplified decision tree for investment in energy infrastructure in the infographic below. If you are mainly concerned with yield (income), then you may have more of a preference for MLPs, whether that’s investing in an individual MLP or accessing the space through an access product like an exchange traded fund (ETF), closed-end fund (CEF) or exchange traded note (ETN). If you invest in a product that is 100% MLPs, the benefits are yield and tax-deferred return of capital, but in general, you are not getting full exposure to the midstream universe, given the significance of C Corporations, such as KMI, OKE and WMB.

If you are more focused on total return and want to own a single security, and don’t want a K-1, a C Corporation may be more appealing to you. Otherwise, you may prefer to own a RIC-compliant access product that owns both MLPs and C Corporations (for an explanation of RIC-compliant funds, see the Applied MLPs section of MLP University). With MLPs capped at 25% for RIC compliance, you’ll be giving up yield and a smaller portion of the income will be considered a tax-deferred return of capital. However, you’ll be gaining broader exposure to the energy infrastructure universe. You’ll also want to be aware of what makes up the other 75% of the fund, whether it’s energy infrastructure corporations, Canadian energy infrastructure companies, utilities, oil and gas producers or even energy consumers.

This is the image alt text

Bottom Line:

It may not feel like it, but K-1 issuers continue to represent a significant portion of the US midstream space. Yes, we will probably continue to see restructurings and some conversions to C Corporations, particularly for MLPs with incentive distribution rights in the higher split levels. That said, it’s a little premature to make the call that the MLP structure is going to be abandoned in favor of the C-Corp structure. As the midstream space evolves, investors may need to be more discerning in terms of how they gain exposure to energy infrastructure. Fortunately, with a variety of access products complementing options to invest in C Corporations or MLPs directly, investors can tailor their exposure to meet their needs.

» Popular Pages

  • Tickers
  • Articles

Sep 29

A Fixed Income Primer for Constructing Portfolios

Sep 29

Main Management Market Note: September 29, 2023

Sep 29

Higher for Much Longer?

Sep 29

Moving Averages: S&P Ends September Down 4.9%

Sep 29

This Week in ETFs: FormulaFolios Renamed & Adds New Funds

Sep 29

Play Online Car Sales News in These 2 China ETFs

Sep 29

SEC Opens Ethereum Futures ETF Floodgates

Sep 29

VettaFi Voices On: Managing Risk in an Uncertain Economy

Sep 29

SPYI Outperforms SPY in Challenging 3rd Quarter

Sep 29

More Rate Hikes? Watch Treasury ETF USFR

QQQ

Invesco QQQ Trust Series I

SPY

SPDR S&P 500 ETF Trust

VOO

Vanguard S&P 500 ETF

JEPI

JPMorgan Equity Premium...

TLT

iShares 20+ Year Treasury...

SCHD

Schwab US Dividend Equity ETF...

SMH

VanEck Semiconductor ETF

VGT

Vanguard Information...

VTI

Vanguard Total Stock Market...

XLK

Technology Select Sector SPDR...

Loading Articles...
Our Sites
  • VettaFi
  • Advisor Perspectives
  • ETF Trends
Tools
  • ETF Screener
  • Mutual Fund to ETF Converter
  • Head-To-Head ETF Comparison
  • ETF Country Exposure Tool
  • ETF Stock Exposure Tool
  • ETF Database Pro
More Tools
  • Financial Advisor & RIA Center
Explore ETFs
  • ETF News
  • ETF Category Reports
  • Premium Articles
  • Alphabetical Listing of ETFs
  • Browse ETFs by ETF Database Category
  • Browse ETFs by Index
  • Browse ETFs by Issuer
  • Compare ETFs
Information
  • Contact Us
  • Terms of Use and Privacy Policy
  • © 2023 VettaFi LLC. All rights reserved.

Advertisement

Is Your Portfolio Positioned With Enough Global Exposure?

ETF Education Channel

How to Allocate Commodities in Portfolios

Tom LydonApr 26, 2022
2022-04-26

A long-running debate in asset allocation circles is how much of a portfolio an investor should...

Core Strategies Channel

Why ETFs Experience Limit Up/Down Protections

Karrie GordonMay 13, 2022
2022-05-13

In a digital age where information moves in milliseconds and millions of participants can transact...

}
X