ETFdb Logo
  • ETF Database
  • Content Hubs
    • Themes
      • Active ETF
      • Alternatives
      • Artificial Intelligence
      • China Insights
      • Core Strategies
      • Crypto
      • Disruptive Technology
      • Energy Infrastructure
      • ETF Building Blocks
      • ETF Investing
      • ETF Strategist
      • Financial Literacy
      • Fixed Income
      • Free Cash Flow
      • Future ETFs
      • Innovative ETFs
      • Institutional Income Strategies
      • Leveraged & Inverse
      • Market Insights
      • Market Outlooks
      • Modern Alpha
      • Nuclear Energy
      • Portfolio Strategies
      • Sector Investing
      • Tax Efficient Income
      • Thematic Investing
    • Asset Class
      • Equity
        • U.S. Equity
        • Int'l Developed
        • Emerging Market Equities
      • Alternatives
        • Gold/Silver/Critical Materials
        • Cryptocurrency
        • Currency
        • Volatility
      • Fixed Income
        • Investment Grade Corporates
        • US Treasuries & TIPS
        • High Yield Corporates
        • Int'l Fixed Income
    • ETF Ecosystem
    • ETFs in Canada
    • Market Outlook
    • Crypto ETF Hub
  • Tools
    • ETF Screener
    • ETF Country Exposure Tool
    • ETF Database Categories
    • Indexes
    • Scenario Analysis
    • Watchlists
    • Head-To-Head ETF Comparison Tool
    • Mutual Fund To ETF Converter
    • ETF Stock Exposure Tool
    • ETF Issuer Fund Flows
  • Research
    • ETF Education
    • Equity Investing
    • Dividend ETFs
    • Leveraged ETFs
    • Inverse ETFs
    • Index Education
    • Index Insights
    • Top ETF Sectors
    • Top ETF Issuers
    • Top ETF Industries
  • Webcasts
  • Sectors
    • Sector Investing Content Hub
    • XLK
    • XLI
    • XLU
    • XLY
    • XLP
    • XLRE
    • Sector Power Rankings
    • XLE
    • XLC
    • XLF
    • XLV
    • XLB
  • Multimedia
    • ETF 360 Video Series
    • ETF of the Week Podcast
    • Gaining Perspective Podcast
    • ETF Prime Podcast
    • Video
  • Company
    • About VettaFi
  • PRO
    • Pro Content
    • Pro Tools
    • Advanced
    • FAQ
    • Free sign up
    • Login
  1. Index Insights
  2. By the Numbers: Distributions in Jeopardy?
Index Insights
Share

By the Numbers: Distributions in Jeopardy?

Maria HalmoFeb 09, 2015
2015-02-09

If you called or emailed Alerian with a question about commodity prices over the past several months, you’ve probably heard someone on our team tell you that long-term fundamentals for most MLPs remain unchanged. That said, there’s one subsector in particular that needs a change in the near- and medium-term environment if it wants to be around for the long term.

Upstream MLPs are directly exposed to commodity prices. Their business model consists of buying oil and gas fields, optimizing them, and selling the resulting production to the market. Because its asset base of oil and gas reserves is always declining, an upstream MLP can only maintain its distribution if at least one of the following things is happening: commodity prices are rising, fields are available for purchase at a valuation cheaper than the company’s current trading multiple, and/or current fields are operated more efficiently. During the second half of 2014, commodity prices fell so quickly that the other two levers became irrelevant, causing a handful of upstream MLPs to cut their distributions this past quarter.

Of the 12 upstream MLPs currently trading, Sanchez Production Partners (SPP) does not pay a distribution and has not since the last commodity bust. Five companies cut their distributions this quarter, and six maintained their distributions.

1Q15 Upstream Distribution Growth

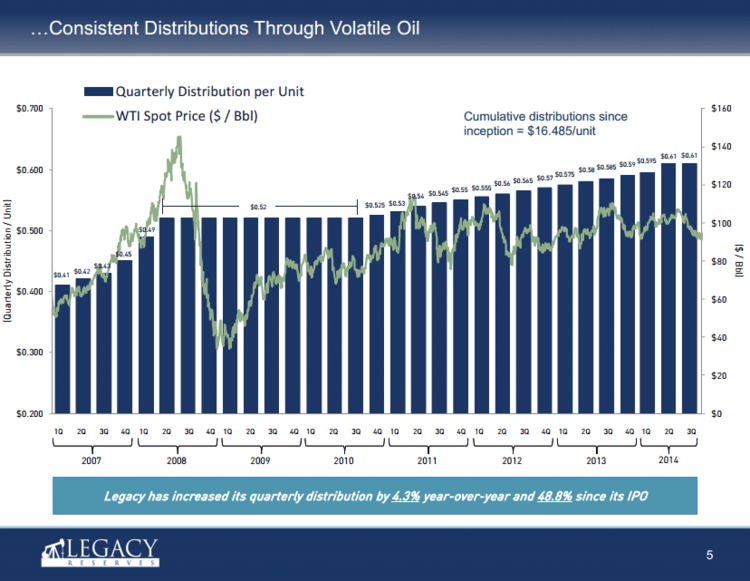
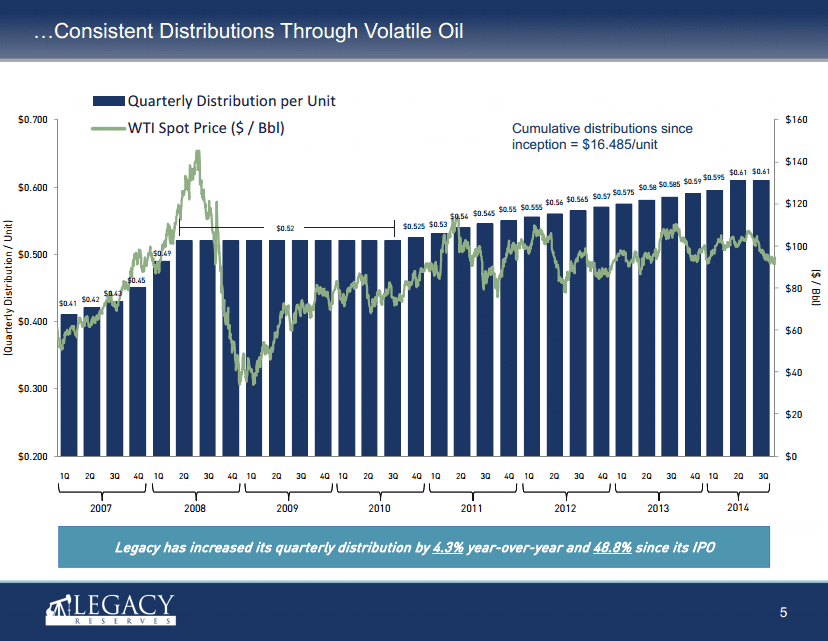
What made the difference? Let’s use an example from each camp. First, Legacy Reserves (LGCY), one of the upstream MLPs that kept its distribution flat this quarter, and has maintained or grown its distribution every quarter since its 2007 IPO. As you can see below, the company managed to do this even during the oil crash of 2008.


Content continues below advertisement

This is the image alt text

When LGCY makes an acquisition, it partially hedges production for the next 3-5 years. Its oil production is 68% hedged for 2015 around $92, and its gas production is 76% hedged at $4.38. For 2016, 21% of oil production is hedged at $89, as is 20% of gas production at $4.26. That’s a decent amount of forward production sold at prices much higher than today’s.

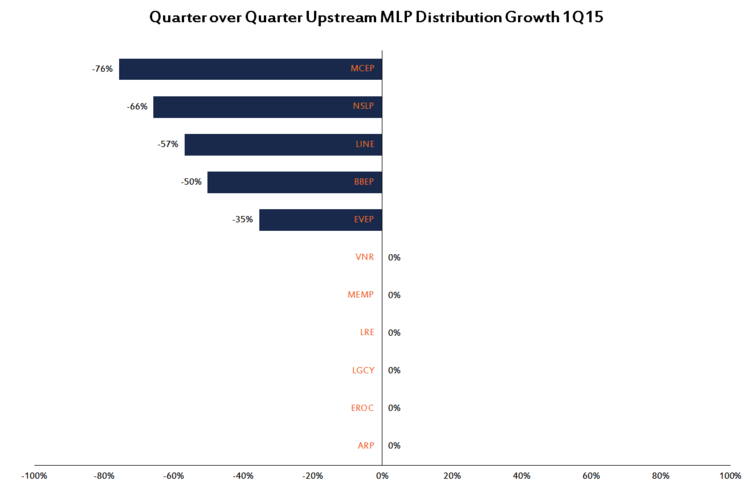
On the other end of the spectrum is Mid-Con Energy Partners (MCEP), which cut its quarterly distribution 76% to $0.125 from $0.515. MCEP has 98% of its production weighted towards crude, and has hedged 74% of 2015 oil production at $76 and 56% of 2016 production at $70.

If the average price of crude stays at $50 for 2015, LGCY’s oil-related cash flow is better positioned.

LGCY 2015: (68% * $92) + (32% * $50) = $78.56
MCEP 2015: (74% * $76) + (26% * $50) = $69.24

But if oil prices stay at $50 through 2016, MCEP is better positioned.

LGCY 2016: (21% * $89) + (79% * $50) = $58.19
MCEP 2016: (56% * $70) + (44% * $50) = $61.20

By keeping its distribution flat for now and hedging out a lower percentage of 2016 production, LGCY is taking the more uncertain route of hoping that oil prices recover before next year is over. By cutting its distribution now instead, MCEP sports a coverage ratio of nearly two times, giving the company some wiggle room if prices don’t rebound sooner. LGCY is waiting it out, and MCEP is being more proactive. It may also be more psychologically difficult for a company that has paid eight years of stable and growing distributions (LGCY) to grab the knife than for a company with just over three years of trading history (MCEP) under its belt to do the same. Since crude oil’s June 20th peak, LGCY is down 52.5% on a price return basis while MCEP is off 69.1%. Sure, the former has done 16.6% better, but the market isn’t exactly treating LGCY’s current distribution as secure.

If you’re panicked that the upstream names are taking the entire MLP structure down with them, remember that they are only about 3% of MLP market cap. Assuming the weightings in your diverse MLP portfolio are consistent with the broader universe, a worst-case scenario where every upstream MLP goes bankrupt costs you 300 basis points of performance.

» Popular Pages

  • Tickers
  • Articles

Jun 22

World Markets Watchlist: June 22, 2026

Jun 22

Emerging Markets to Spike as Oil Prices Dip? Try GSEE

Jun 22

Look Beyond Market Euphoria After 3 FCF ETFs Rebalanced

Jun 22

Private Credit Offers Viable Yield Path as Rates Stay Elevated

Jun 22

Franklin Files for Bitcoin-Integrated Dividend ETFs

Jun 22

Managing Exposure to International Equity ETFs Amid UK Political Shifts

Jun 22

Physical AI & Global Reshoring Beyond the Humanoid Hype

Jun 22

VIDEO: ETF of the Week: VFLO

Jun 22

Gaming ETF GAMR Adds Arcade Gaming Giant to Portfolio

Jun 22

Weekly Economic Snapshot: A Hawkish Hold in a High-Stakes Market

QQQ

Invesco QQQ Trust Series I

VOO

Vanguard S&P 500 ETF

GLD

SPDR Gold Shares

PPLT

abrdn Physical Platinum...

SIVR

abrdn Physical Silver Shares...

FOTO

Tuttle Capital Pure Play...

SMH

VanEck Semiconductor ETF

DRAM

Roundhill Memory ETF

SCHD

Schwab US Dividend Equity ETF...

IVV

iShares Core S&P 500 ETF

Loading Articles...

Advertisement

Is Your Portfolio Positioned With Enough Global Exposure?

ETF Education Channel

How to Allocate Commodities in Portfolios

Tom LydonApr 26, 2022
2022-04-26

A long-running debate in asset allocation circles is how much of a portfolio an investor should...

Core Strategies Channel

Why ETFs Experience Limit Up/Down Protections

Karrie GordonMay 13, 2022
2022-05-13

In a digital age where information moves in milliseconds and millions of participants can transact...

}
X