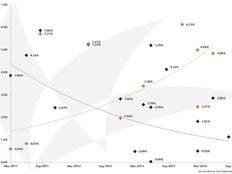
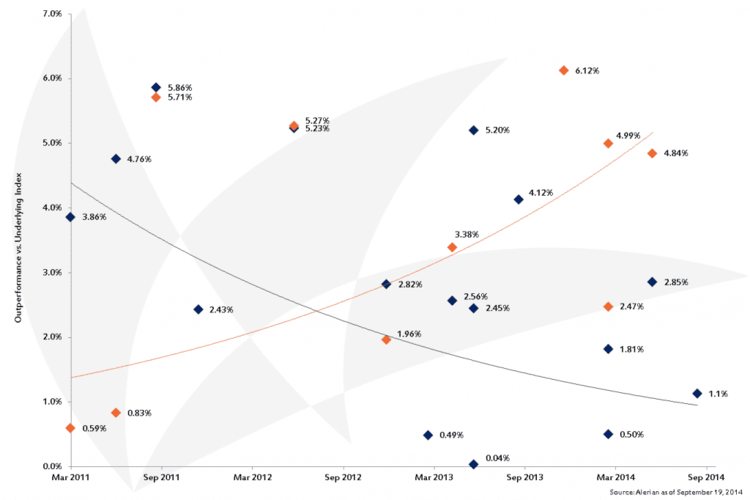
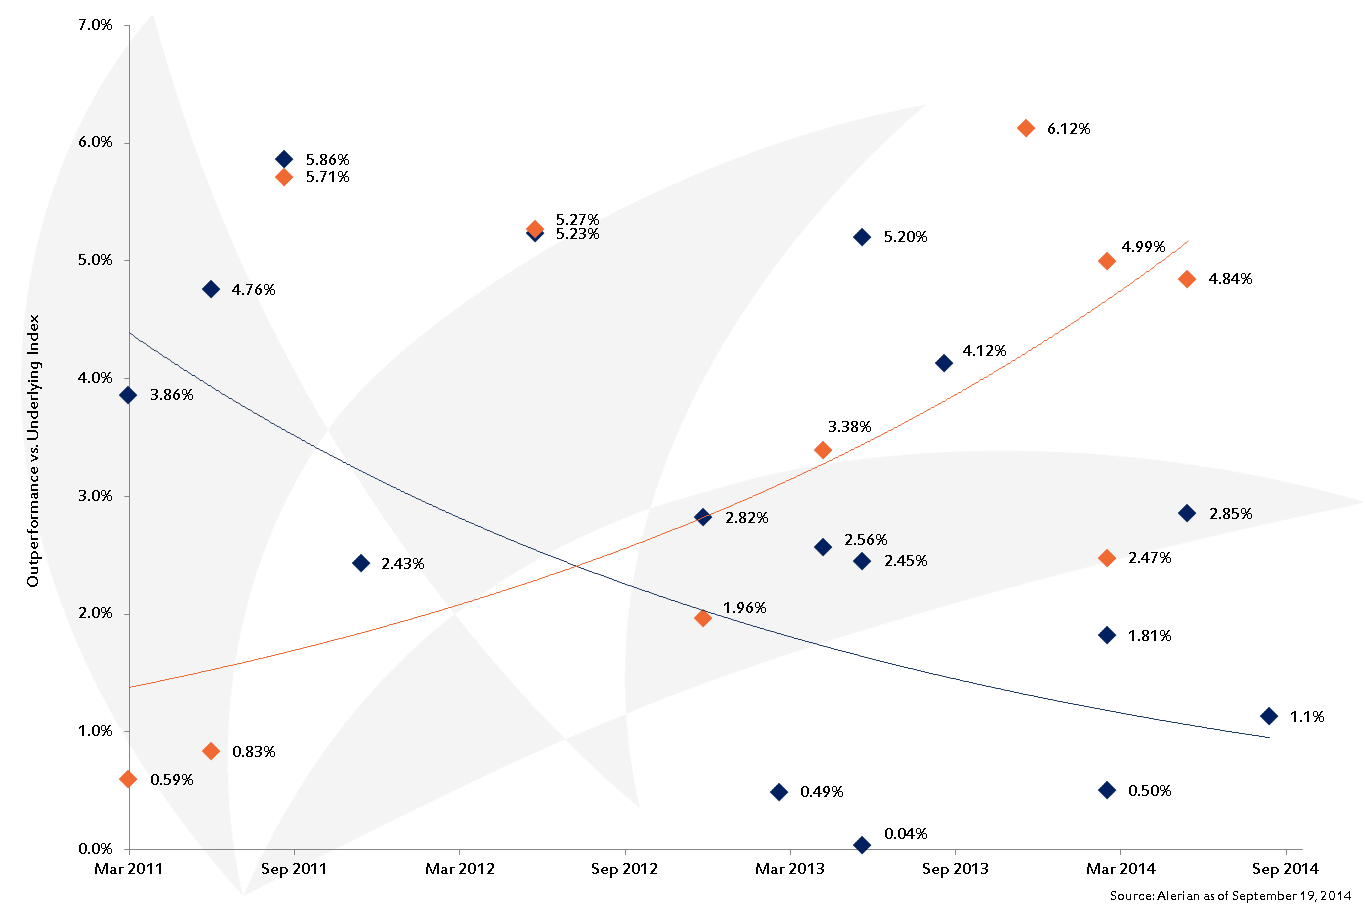
ETFdb Logo
  • ETF Database
  • Content Hubs
    • Themes
      • Active ETF
      • Alternatives
      • Artificial Intelligence
      • China Insights
      • Core Strategies
      • Crypto
      • Disruptive Technology
      • Energy Infrastructure
      • ETF Building Blocks
      • ETF Investing
      • ETF Strategist
      • Financial Literacy
      • Fixed Income
      • Free Cash Flow
      • Future ETFs
      • Innovative ETFs
      • Institutional Income Strategies
      • Leveraged & Inverse
      • Market Insights
      • Market Outlooks
      • Modern Alpha
      • Nuclear Energy
      • Portfolio Strategies
      • Sector Investing
      • Tax Efficient Income
      • Thematic Investing
    • Asset Class
      • Equity
        • U.S. Equity
        • Int'l Developed
        • Emerging Market Equities
      • Alternatives
        • Gold/Silver/Critical Materials
        • Cryptocurrency
        • Currency
        • Volatility
      • Fixed Income
        • Investment Grade Corporates
        • US Treasuries & TIPS
        • High Yield Corporates
        • Int'l Fixed Income
    • ETF Ecosystem
    • ETFs in Canada
    • Market Outlook
    • Crypto ETF Hub
  • Tools
    • ETF Screener
    • ETF Country Exposure Tool
    • ETF Database Categories
    • Indexes
    • Scenario Analysis
    • Watchlists
    • Head-To-Head ETF Comparison Tool
    • Mutual Fund To ETF Converter
    • ETF Stock Exposure Tool
    • ETF Issuer Fund Flows
  • Research
    • ETF Education
    • Equity Investing
    • Dividend ETFs
    • Leveraged ETFs
    • Inverse ETFs
    • Index Education
    • Index Insights
    • Top ETF Sectors
    • Top ETF Issuers
    • Top ETF Industries
  • Webcasts
  • Sectors
    • Sector Investing Content Hub
    • XLK
    • XLI
    • XLU
    • XLY
    • XLP
    • XLRE
    • Sector Power Rankings
    • XLE
    • XLC
    • XLF
    • XLV
    • XLB
  • Multimedia
    • ETF 360 Video Series
    • ETF of the Week Podcast
    • Gaining Perspective Podcast
    • ETF Prime Podcast
    • Video
  • Company
    • About VettaFi
  • PRO
    • Pro Content
    • Pro Tools
    • Advanced
    • FAQ
    • Free sign up
    • Login
  1. Index Insights
  2. By the Numbers: The Alerian Inclusion Effect
Index Insights
Share

By the Numbers: The Alerian Inclusion Effect

Emily HsiehSep 23, 2014
2014-09-23

The phones at Alerian definitely ring a lot more during quarterly rebalancing months (March, June, September, and December). For those that don’t have the rebalancing schedule memorized by heart: On the first Friday of the quarterly rebalancing month, final numbers for share count, float, and trading volume are run after market close. On the second Friday, constituent additions and deletions are announced prior to market open. And on the third Friday, all Alerian indices are rebalanced after close. Final constituents and weightings are updated (and available for download) on each index’s page prior to the following Monday’s open.

Between the first and second Friday, people call to see if they can glean any information about who will be added to or removed from an Alerian index. Between the second and third Friday, people call asking about how many shares will need to be traded in and out of a particular name. Why all this commotion?

Since March 2011, when a name has been added to either the Alerian MLP Index (AMZ) or the Alerian MLP Infrastructure Index (AMZI), that MLP has outperformed the respective index it was added to on the day of the announcement. The chart below shows the day-of outperformance for the AMZ (in blue) and AMZI (in orange).

2014.11.24 By the Numbers - The Alerian Effect

(click to enlarge)

Average outperformance of a company added to either index has been 316 basis points (bps), ranging from 4 bps to as high as 612 bps. We like to call this phenomenon “The Alerian Effect”, shamelessly coined after the “S&P Effect”, describing how a company’s share price jumps when they are selected to the S&P 500 Index (SPX), since all the products tracking the index will need to buy the company’s shares.

As of August 29, over $21 billion in assets (via ETNs, ETFs, SMAs, mutual funds, structured notes, total return swaps, and variable insurance products) are linked to the AMZ ($7.7 billion) and AMZI ($13.3 billion).

If an MLP is added to the AMZ with a 1% weighting, then $77 million worth of units (shares) would need to be bought by tracking products. Read By the Numbers: Trading Days to Exit for how many trading days it would take to buy $77 million worth of an MLP.

As you look at the chart, you’re probably noticing the upward trending orange line for the AMZI and downward plateauing blue line for the AMZ. The R-squared value for the AMZI orange line and AMZ blue line are 0.36 and 0.14, respectively, so neither line is definitely conclusive of a trend. But, we wanted to include the line to show that the “AMZI Effect” (362 bps outpeformance) has become more pronounced than the “AMZ Effect” (288 bps outperformance), as the amount of linked product AUM tracking the AMZI has exceeded that of the AMZ since late 2012. The AMZI also only has 25 constituents to the AMZ’s 50, so constituent weightings tend to be higher in the AMZI, meaning more units need to be bought.

Due to the Alerian Effect, AMZI Effect, and AMZ Effect (or whatever you want to call it), we cannot stress enough the importance of an index provider being independent and without conflicts of interest. Similar to how public companies have quiet periods before earnings, Alerian engages in a two-week quiet period from the first to third Friday of every quarterly rebalancing month, where we refrain from discussing rebalancing and/or clarifying methodology. Now that the September rebalancing is complete, we’re happy to answer any questions you may have.

In the next part of this series, we will discuss the day-of announcement impact to MLPs being removed from the index, as well as equity performance between the announcement and rebalancing dates for entering and exiting names. Stay tuned.


Content continues below advertisement

» Popular Pages

  • Tickers
  • Articles

Jun 22

World Markets Watchlist: June 22, 2026

Jun 22

Emerging Markets to Spike as Oil Prices Dip? Try GSEE

Jun 22

Look Beyond Market Euphoria After 3 FCF ETFs Rebalanced

Jun 22

Private Credit Offers Viable Yield Path as Rates Stay Elevated

Jun 22

Franklin Files for Bitcoin-Integrated Dividend ETFs

Jun 22

Managing Exposure to International Equity ETFs Amid UK Political Shifts

Jun 22

Physical AI & Global Reshoring Beyond the Humanoid Hype

Jun 22

VIDEO: ETF of the Week: VFLO

Jun 22

Gaming ETF GAMR Adds Arcade Gaming Giant to Portfolio

Jun 22

Weekly Economic Snapshot: A Hawkish Hold in a High-Stakes Market

QQQ

Invesco QQQ Trust Series I

VOO

Vanguard S&P 500 ETF

SMH

VanEck Semiconductor ETF

GLD

SPDR Gold Shares

DRAM

Roundhill Memory ETF

SOXX

iShares Semiconductor ETF

SCHD

Schwab US Dividend Equity ETF...

PPLT

abrdn Physical Platinum...

SOXL

Direxion Daily Semiconductor...

SIVR

abrdn Physical Silver Shares...

Loading Articles...

Advertisement

Is Your Portfolio Positioned With Enough Global Exposure?

ETF Education Channel

How to Allocate Commodities in Portfolios

Tom LydonApr 26, 2022
2022-04-26

A long-running debate in asset allocation circles is how much of a portfolio an investor should...

Core Strategies Channel

Why ETFs Experience Limit Up/Down Protections

Karrie GordonMay 13, 2022
2022-05-13

In a digital age where information moves in milliseconds and millions of participants can transact...

}
X