ETFdb Logo
ETFdb Logo
  • ETF Database
  • Channels
    • Themes
      • Active ETF
      • Artificial Intelligence
      • Beyond Basic Beta
      • China Insights
      • Climate Insights
      • Core Strategies
      • Crypto
      • Direct Indexing
      • Disruptive Technology
      • Energy Infrastructure
      • ETF Building Blocks
      • ETF Investing
      • ETF Education
      • ETF Strategist
      • Financial Literacy
      • Fixed Income
      • Free Cash Flow
      • Innovative ETFs
      • Institutional Income Strategies
      • Leveraged & Inverse
      • Managed Futures
      • Market Insights
      • Modern Alpha
      • Multifactor
      • Responsible Investing
      • Retirement Income
      • Tax Efficient Income
    • Asset Class
      • Equity
        • U.S. Equity
        • Int'l Developed
        • Emerging Market Equities
      • Alternatives
        • Commodities
        • Gold/Silver/Critical Minerals
        • Currency
        • Volatility
      • Fixed Income
        • Investment Grade Corporates
        • US Treasuries & TIPS
        • High Yield Corporates
        • Int'l Fixed Income
    • ETF Ecosystem
    • ETFs in Canada
  • Tools
    • ETF Screener
    • ETF Country Exposure Tool
    • ETF Sector Tracker Tool
    • ETF Database Categories
    • Head-To-Head ETF Comparison Tool
    • ETF Stock Exposure Tool
    • ETF Issuer Fund Flows
    • Indexes
    • Mutual Fund To ETF Converter
  • Research
    • ETF Education
    • Equity Investing
    • Dividend ETFs
    • Leveraged ETFs
    • Inverse ETFs
    • Index Education
    • Index Insights
    • Top ETF Sectors
    • Top ETF Issuers
    • Top ETF Industries
  • Webcasts
  • Themes
    • AI ETFs
    • Blockchain ETFs
    • See all Thematic Investing ETF themes
    • ESG Investing
    • Marijuana ETFs
  • Multimedia
    • ETF 360 Video Series
    • ETF of the Week Podcast
    • ETF Prime Podcast
    • Video
  • Company
    • About VettaFi
    • Get VettaFi’ed
  • PRO
    • Pro Content
    • Pro Tools
    • Advanced
    • FAQ
    • Pricing
    • Free Sign Up
    • Login
  1. Index Insights
  2. Calling the MLP Bottom (After Three Months and a 50% Bounce)
Index Insights
Share

Calling the MLP Bottom (After Three Months and a 50% Bounce)

Kenny FengMay 09, 2016
2016-05-09

It is admittedly gutless to call the MLP bottom after three months and a 50% bounce. Worse, I’m not even directly calling the bottom; I’m just writing about the downturn in the past tense to see what we can learn from the 58% drop in the Alerian MLP Index (AMZ) between August 29, 2014 and February 11, 2016. Our boss is big on encouraging investors to make their own decisions and centering our role on equipping them to do so with objective information. Just call us Switzerland.

Prior to the downturn, MLPs were rewarded for raising their growth capex budgets and funding their projects with cheap external capital. Corporations with assets that generated Section 7704 qualifying income were harassed by activist investors to make use of the MLP structure, and it became a full-time job just to track how far along each company was on the journey of taking its MLP public.

Then the price of crude oil crashed. A Google Ngram Viewer analysis of press releases and earnings conference call transcripts over the last 12 months would undoubtedly find that the lion’s share of discussion was focused on growth capex reductions and deferrals, alternative financing options, and investment-grade counterparties. Almost every executive team seemed singularly focused on one objective: guaranteeing investors that the company would be able to forego the public capital markets in 2016 (and maybe 2017) if need be. The exceptions were those that had the clearest visibility to funded, multi-year distribution growth. That said, a crashing tide sinks all boats, or at least sends those on board back to their cabins in search of Dramamine.

Now that we might be in the clear, we thought it might be interesting to look back on that 17.5-month period and see whose head stayed above water and who was fully submerged—“lessons learned” that can be applied to the inevitable next downturn in the energy business. To do so, we calculated price returns for the 105 energy MLPs that were publicly traded for the entire peak-to-trough period and examined results at the company level, Energy MLP Classification Standard (EMCS) level, and GP/LP level. Here’s what we found.

(1) This downturn felt much worse, but wasn’t by much.

This is the image alt text

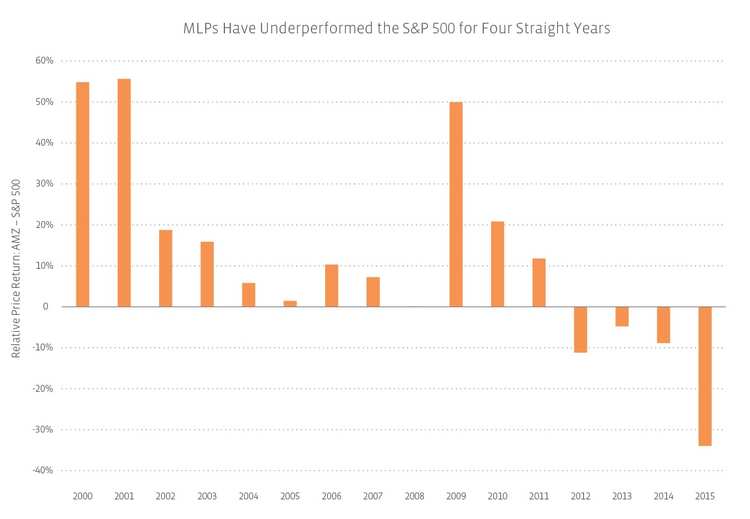
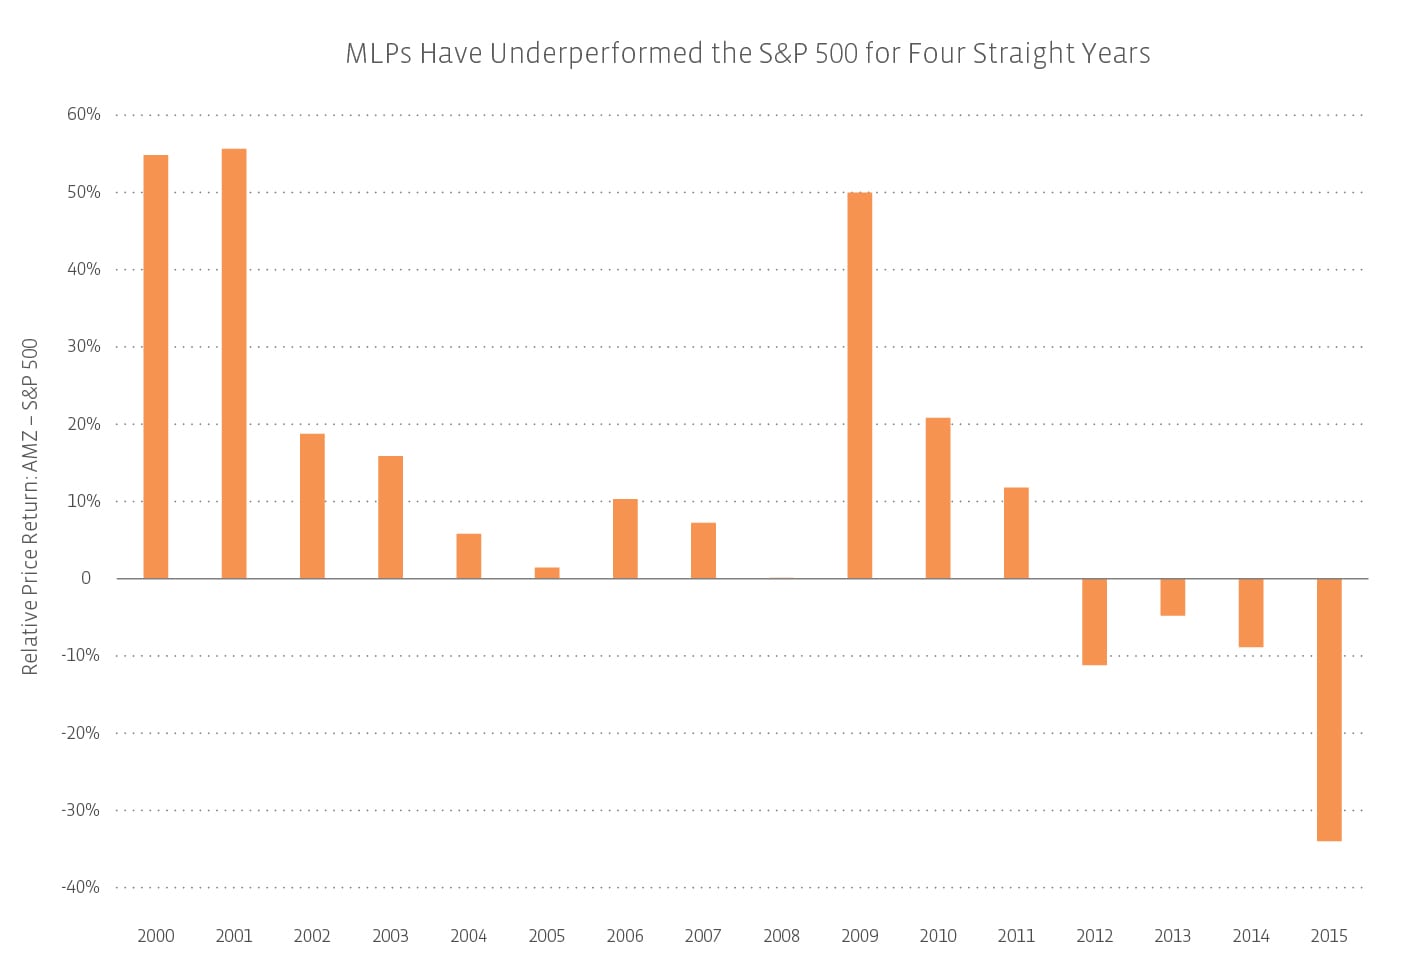
The AMZ shed 58.2% on a total return basis over 365 days, peak to trough. During the last MLP selloff, the AMZ lost 50.1% over 344 days. So why did it feel worse? The answer, as is often the case when discussing the financial markets, is a function of expectations. For one, it was assumed that a downturn of this magnitude couldn’t happen again after the 2008 commodity bust. And yet, when crude cratered again, many businesses were far less resilient than advertised. It also felt worse because MLPs were supposed to be due in 2015; after outperforming the S&P 500 for 12 straight years after the dot-com bubble burst, the AMZ had fallen short against the US bellwether benchmark for three in a row. Instead, MLPs posted their worst year of relative performance in the AMZ’s 20-year recorded history.

(2) The AMZ largely delivered on its beta equals one objective, with one caveat.

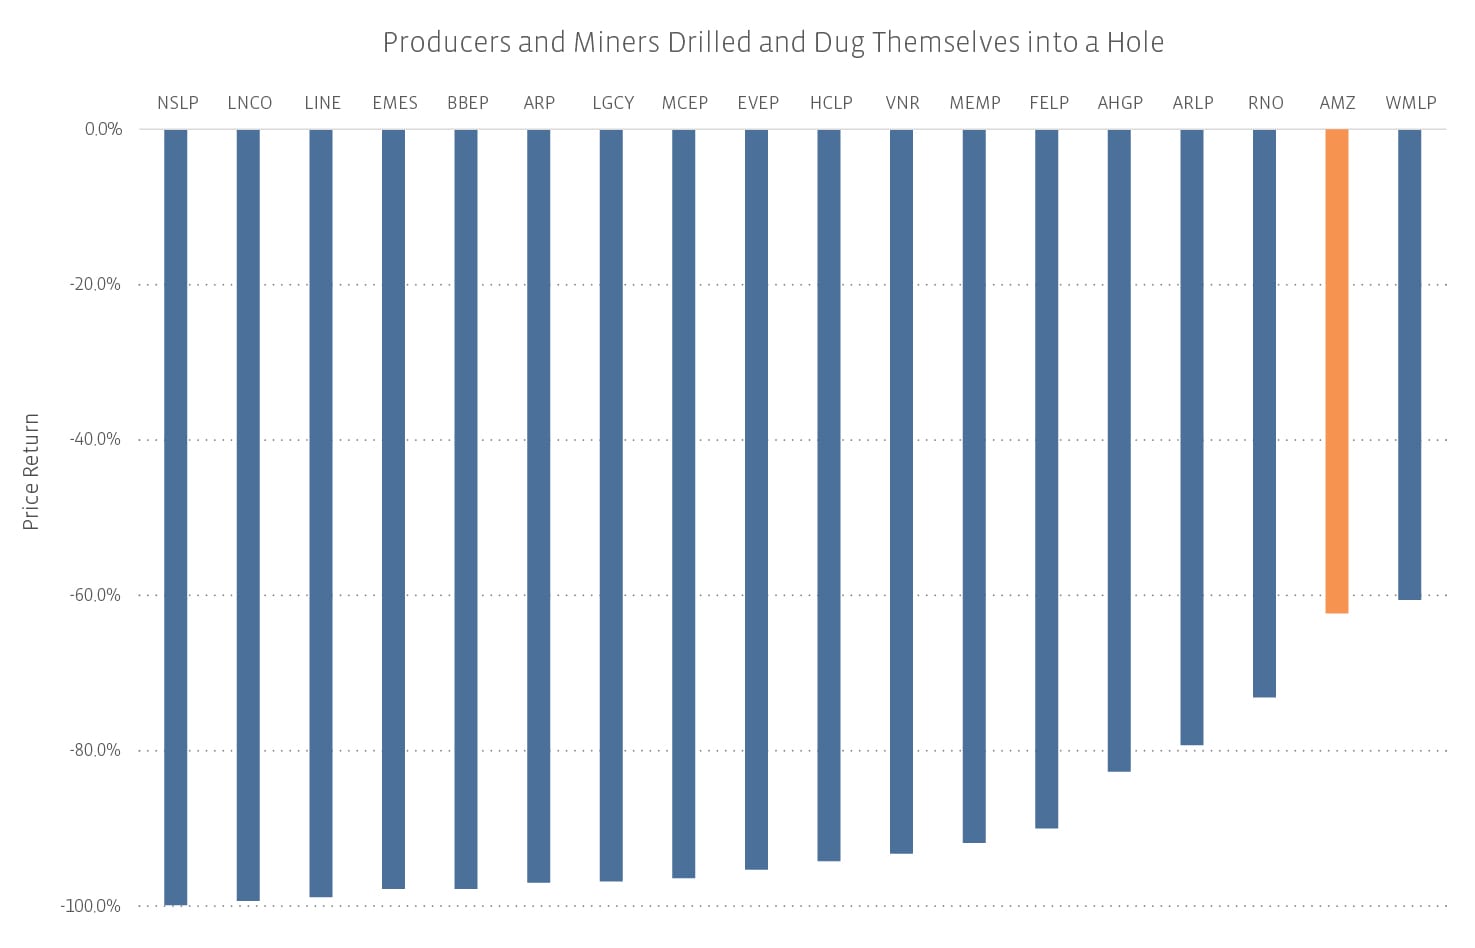
The index’s price return was -62.3% from peak to trough, outperforming the median of 105 MLPs by 4.6 percentage points. But if you take out the 17 production and mining MLPs, the universe’s median return was -62.5%, virtually identical to the AMZ’s drop.

(3) Production and mining: Save Our Ship (or well, or mine).


Content continues below advertisement

This is the image alt text

On that note, breaking news: a business that is directly exposed to commodity prices is going to do poorly when those prices fall. 16 of the 17 production and mining MLPs were in the bottom half of performers during the downturn, and every producer of drill-bit hydrocarbons (DBHs) and both frac sand miners were down at least 90%. Even Alliance Resource Partners (ARLP), which has financed its growth internally for 13 years and had maintained or grown its distribution each quarter since its 1999 IPO, sold off to the tune of 79.3%.

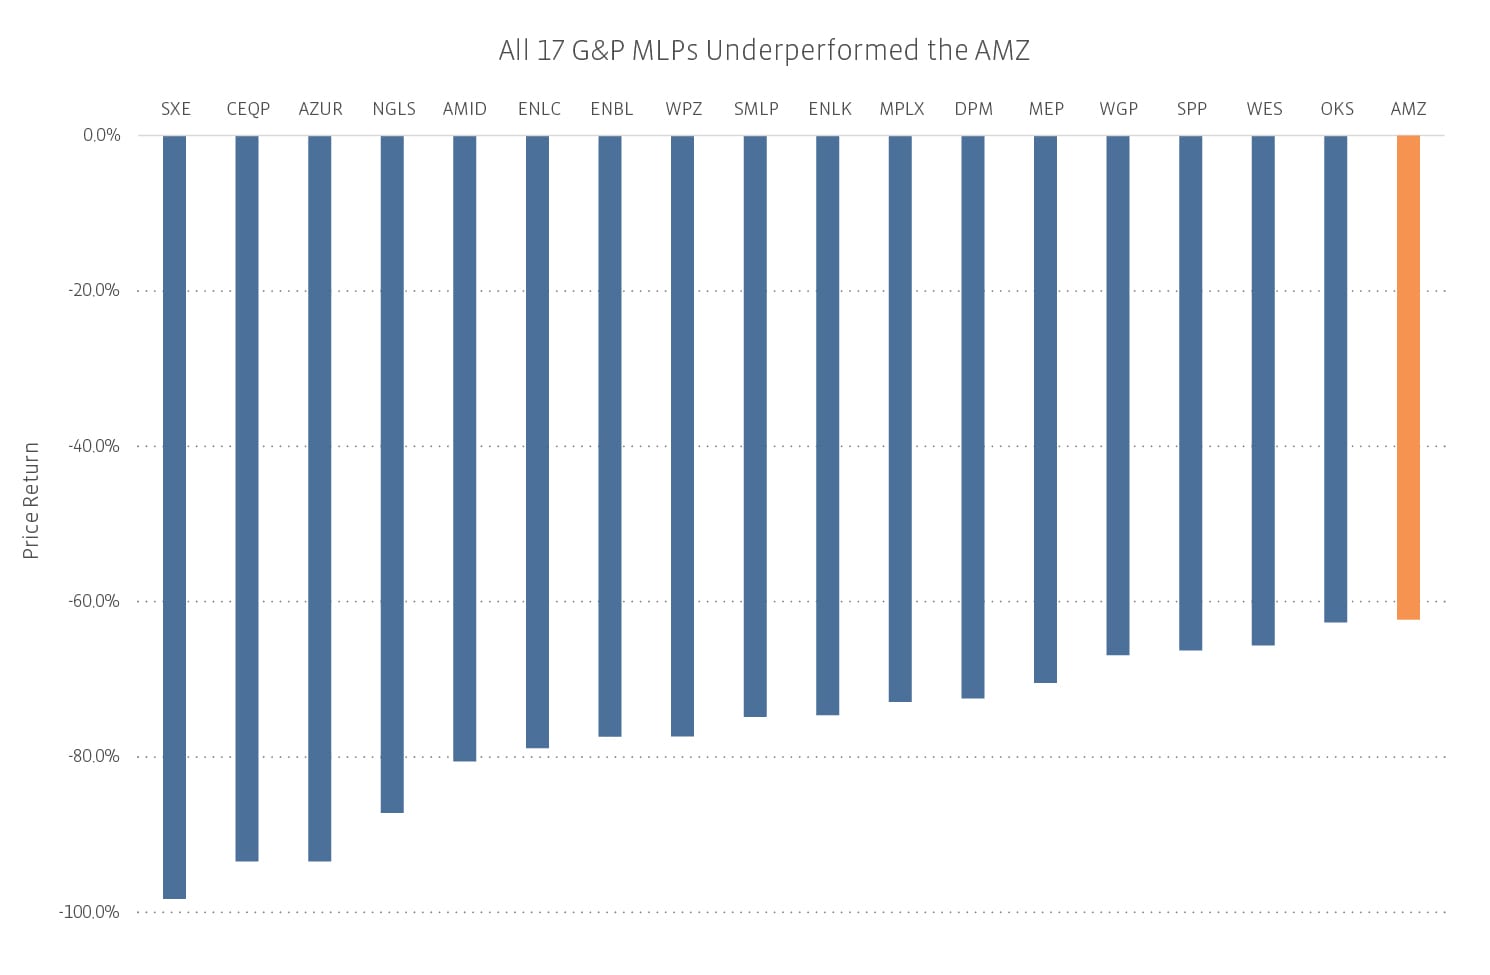
(4) Gathering and processing: closer to upstream = closer to upstream performance.

This is the image alt text

Fee-based doesn’t mean a whole lot if your volumes are drying up, and minimum volume commitments don’t help if a judge can throw out your service agreement in bankruptcy proceedings. The 17 G&P MLPs had a median return of -74.8%. Three posted returns in the top half of the universe: ONEOK Partners (OKS) at -62.6%, Western Gas Partners (WES) at -65.6%, and Sanchez Production Partners (SPP) at -66.3%. If you use the ex-production and mining median instead, not one G&P MLP was in the 50th percentile or above.

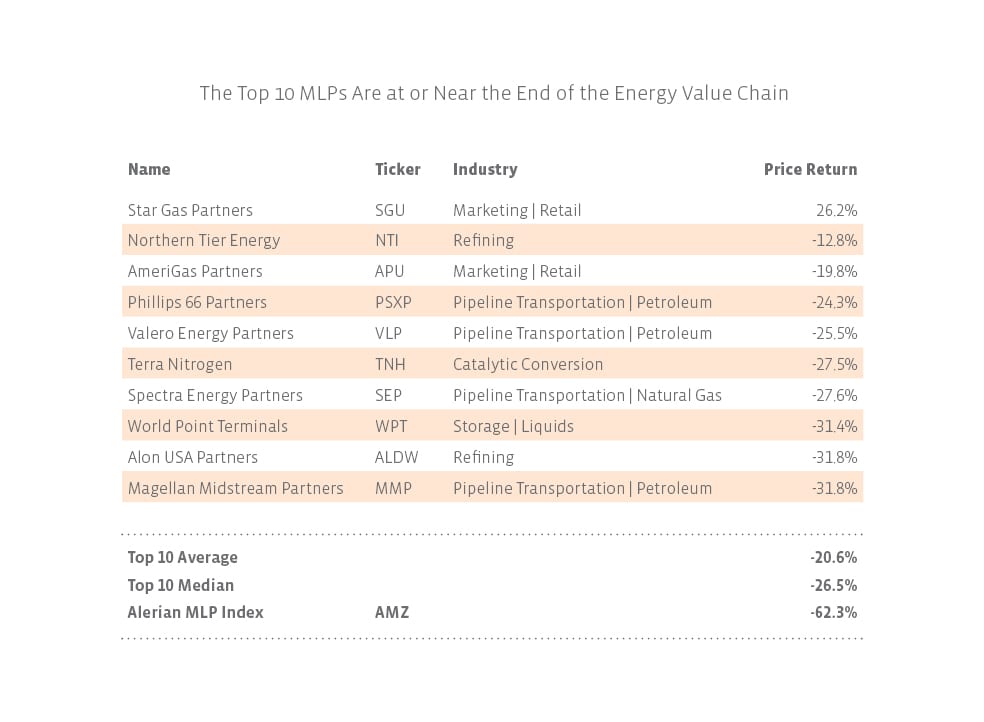
(5) One positive light in an oil and gas well of darkness: Star Gas Partners (SGU).

This is the image alt text

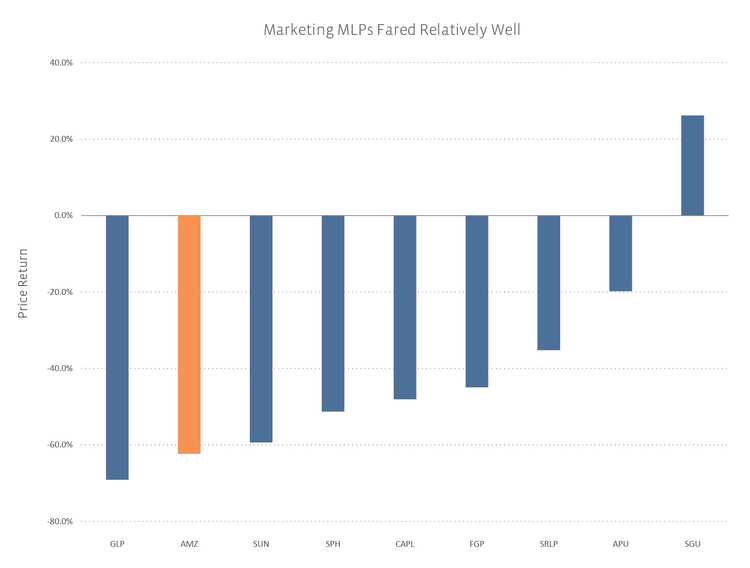
That’s not a typo. Out of 105 MLPs, only SGU escaped negative territory, returning 26.2%. The next best performer, Northern Tier Energy (NTI), was a whopping 39.0 percentage points behind at -12.8%. Six of the other seven wholesale and retail marketers also held up relatively well, with returns ranging from -59.4% to -19.8%. The lone exception was Global Partners (GLP), which tumbled after cutting its distribution earlier this year.

(6) Boring (pipeline and storage MLPs) was less exciting (outperformed).

The 34 pipeline and storage MLPs had a median price return of -49.6%, well ahead of the overall universe. Only seven names were among the bottom half: Rose Rock Midstream (RRMS) at -88.1%, NGL Energy Partners (NGL) at -86.6%, Energy Transfer Equity (ETE) at -81.8%, Plains GP Holdings (PAGP) at -81.8%, Niska Gas Storage Partners (NKA) at -77.4%, Plains All American Pipeline (PAA) at -74.2%, and NuStar GP Holdings (NSH) at -67.2%. NKA was already distressed before the downturn started. The other six suffered from a combination of crude logistics exposure, high leverage, and external financing needs.

(7) Nice defense from the Fab Five.

The five so-called pure-play refinery logistics dropdown MLPs—Delek Logistics Partners (DKL), PBF Logistics (PBFX), Phillips 66 Partners (PSXP), Valero Energy Partners (VLP), and Western Refining Logistics (WNRL)—all posted returns in the top 25. Tesoro Logistics (TLLP), which muddied its story with a G&P acquisition, was 27th. MPLX (MPLX) did the same but fared much worse, underperforming the AMZ due to continued downward revisions of its distribution growth guidance.

(8) I got 99 problems but demand ain’t one (for now).

This is the image alt text

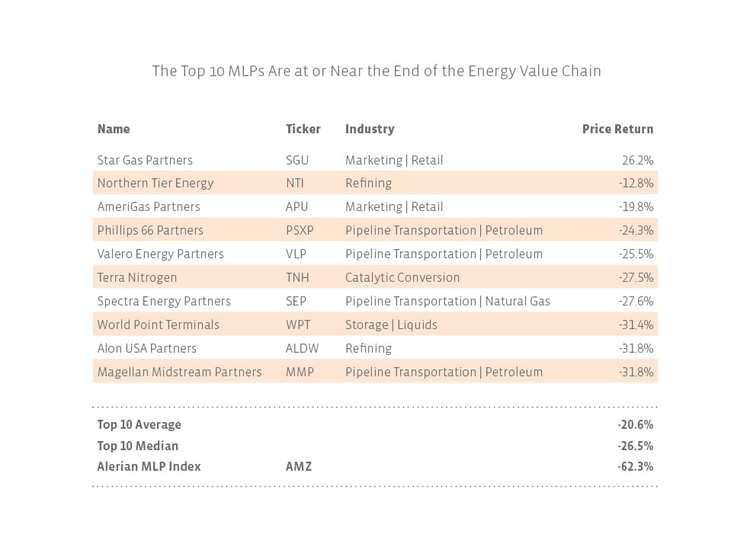
When the problem is with excess supply, demand-pull businesses are better equipped to weather the storm. Rounding out the top 10 alongside the aforementioned SGU, NTI, PSXP, and VLP were companies at or near the end of the energy value chain: AmeriGas Partners (APU), Terra Nitrogen (TNH), Spectra Energy Partners (SEP), World Point Terminals (WPT), Alon USA Partners (ALDW), and Magellan Midstream Partners (MMP).

(9) Leverage is leverage, and GPs don’t always win.

This is the image alt text

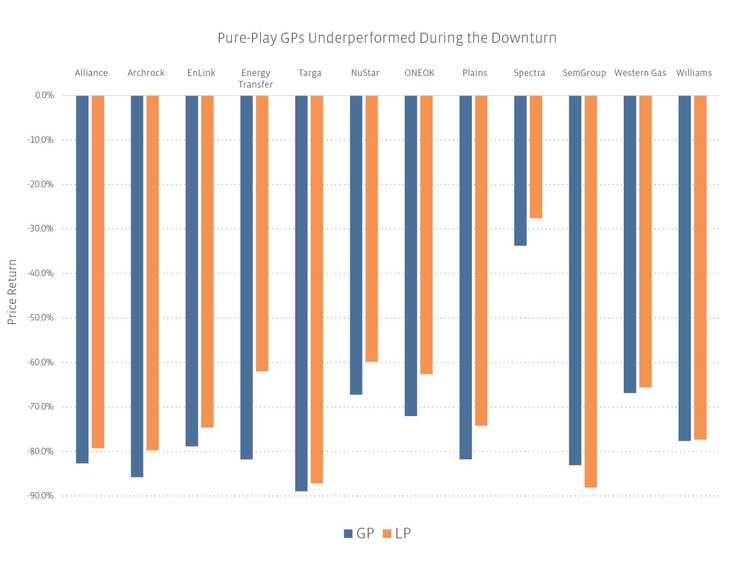
The median price return differential between the 13 pure-play GPs and their underlying LPs was 6.1 percentage points in favor of the latter, and none of the GPs outperformed their underlying LPs on a total return basis during the downturn. In theory, GPs should underperform in a selloff because they are a leveraged play on their underlying LPs. Many stakeholders rightly questioned whether that would pan out empirically given the GP’s lack of fiduciary duty to the LP, particularly when M&A is involved, so it’s interesting to see that it did. That said, mid-single-digit underperformance isn’t much considering this was the worst energy bust we’ve seen in the modern MLP era. Many investors accordingly may be willing to take that modest downside risk to invest alongside management, particular as investor sentiment appears to be stabilizing and inching upward.

2016.05.10 12:45pm CST – Edited to correct three instances in the post where relative performance was stated using % rather than percentage points. 

» Popular Pages

  • Tickers
  • Articles

Sep 29

A Fixed Income Primer for Constructing Portfolios

Sep 29

Main Management Market Note: September 29, 2023

Sep 29

Higher for Much Longer?

Sep 29

Moving Averages: S&P Ends September Down 4.9%

Sep 29

This Week in ETFs: FormulaFolios Renamed & Adds New Funds

Sep 29

Play Online Car Sales News in These 2 China ETFs

Sep 29

SEC Opens Ethereum Futures ETF Floodgates

Sep 29

VettaFi Voices On: Managing Risk in an Uncertain Economy

Sep 29

SPYI Outperforms SPY in Challenging 3rd Quarter

Sep 29

More Rate Hikes? Watch Treasury ETF USFR

QQQ

Invesco QQQ Trust Series I

SPY

SPDR S&P 500 ETF Trust

VOO

Vanguard S&P 500 ETF

JEPI

JPMorgan Equity Premium...

TLT

iShares 20+ Year Treasury...

SCHD

Schwab US Dividend Equity ETF...

SMH

VanEck Semiconductor ETF

VGT

Vanguard Information...

VTI

Vanguard Total Stock Market...

XLK

Technology Select Sector SPDR...

Loading Articles...
Our Sites
  • VettaFi
  • Advisor Perspectives
  • ETF Trends
Tools
  • ETF Screener
  • Mutual Fund to ETF Converter
  • Head-To-Head ETF Comparison
  • ETF Country Exposure Tool
  • ETF Stock Exposure Tool
  • ETF Database Pro
More Tools
  • Financial Advisor & RIA Center
Explore ETFs
  • ETF News
  • ETF Category Reports
  • Premium Articles
  • Alphabetical Listing of ETFs
  • Browse ETFs by ETF Database Category
  • Browse ETFs by Index
  • Browse ETFs by Issuer
  • Compare ETFs
Information
  • Contact Us
  • Terms of Use and Privacy Policy
  • © 2023 VettaFi LLC. All rights reserved.

Advertisement

Is Your Portfolio Positioned With Enough Global Exposure?

ETF Education Channel

How to Allocate Commodities in Portfolios

Tom LydonApr 26, 2022
2022-04-26

A long-running debate in asset allocation circles is how much of a portfolio an investor should...

Core Strategies Channel

Why ETFs Experience Limit Up/Down Protections

Karrie GordonMay 13, 2022
2022-05-13

In a digital age where information moves in milliseconds and millions of participants can transact...

}
X