ETFdb Logo
ETFdb Logo
  • ETF Database
  • Channels
    • Themes
      • Active ETF
      • Artificial Intelligence
      • Beyond Basic Beta
      • China Insights
      • Climate Insights
      • Core Strategies
      • Crypto
      • Direct Indexing
      • Disruptive Technology
      • Energy Infrastructure
      • ETF Building Blocks
      • ETF Investing
      • ETF Education
      • ETF Strategist
      • Financial Literacy
      • Fixed Income
      • Free Cash Flow
      • Innovative ETFs
      • Institutional Income Strategies
      • Leveraged & Inverse
      • Managed Futures
      • Market Insights
      • Modern Alpha
      • Multifactor
      • Responsible Investing
      • Retirement Income
      • Tax Efficient Income
    • Asset Class
      • Equity
        • U.S. Equity
        • Int'l Developed
        • Emerging Market Equities
      • Alternatives
        • Commodities
        • Gold/Silver/Critical Minerals
        • Currency
        • Volatility
      • Fixed Income
        • Investment Grade Corporates
        • US Treasuries & TIPS
        • High Yield Corporates
        • Int'l Fixed Income
    • ETF Ecosystem
    • ETFs in Canada
  • Tools
    • ETF Screener
    • ETF Country Exposure Tool
    • ETF Sector Tracker Tool
    • ETF Database Categories
    • Head-To-Head ETF Comparison Tool
    • ETF Stock Exposure Tool
    • ETF Issuer Fund Flows
    • Indexes
    • Mutual Fund To ETF Converter
  • Research
    • ETF Education
    • Equity Investing
    • Dividend ETFs
    • Leveraged ETFs
    • Inverse ETFs
    • Index Education
    • Index Insights
    • Top ETF Sectors
    • Top ETF Issuers
    • Top ETF Industries
  • Webcasts
  • Themes
    • AI ETFs
    • Blockchain ETFs
    • See all Thematic Investing ETF themes
    • ESG Investing
    • Marijuana ETFs
  • Multimedia
    • ETF 360 Video Series
    • ETF of the Week Podcast
    • ETF Prime Podcast
    • Video
  • Company
    • About VettaFi
    • Get VettaFi’ed
  • PRO
    • Pro Content
    • Pro Tools
    • Advanced
    • FAQ
    • Pricing
    • Free Sign Up
    • Login
  1. Index Insights
  2. Distribution Coverage: Perhaps a Pleasant Surprise?
Index Insights
Share

Distribution Coverage: Perhaps a Pleasant Surprise?

Stacey Morris, CFAApr 09, 2018
2018-04-09

Investors occasionally ask us what distribution coverage looks like for MLPs. While it may seem straightforward, it is somewhat of a loaded question. Distribution coverage (or coverage ratio) compares distributable cash flow (DCF) generated in a period to the total cash distributions paid for that period. Investors look at distribution coverage to better understand an MLP’s ability to pay distributions from the cash generated by its operations. A coverage ratio consistently below 1.0x could indicate that an MLP may not be able to maintain its distribution, while a higher coverage ratio (above 1.0x) enhances investors’ confidence in the MLP’s ability to continue paying or growing its distribution.

While coverage ratio seems easy enough, the complication comes from the fact that distributable cash flow is a non-GAAP metric. As a non-GAAP metric, MLPs have flexibility to calculate distributable cash flow in different ways. As such, one MLP’s distributable cash flow, and therefore coverage ratio, may not be comparable with the same metrics reported by another MLP. Many MLPs derive DCF from adjusted EBITDA, which is also a non-GAAP term. If adjusted EBITDA is used as the starting point, MLPs often subtract maintenance capital, cash interest expense, cash income taxes and other items to calculate DCF.

While coverage ratios have many nuances, we have attempted to provide a helpful snapshot of 4Q17 and 4Q16 coverage ratios for the constituents of the Alerian MLP Infrastructure Index (AMZI). We chose 4Q17 as the most recent quarter and provided the 4Q16 numbers for additional context. Coverage ratios shown are those provided by the company. In cases where the company does not provide a quarterly coverage ratio (denoted by an asterisk), we calculated coverage as discussed in the footnotes to the table. Keep in mind, the ratios will not be apples to apples when comparing across the companies, but they should be consistent when comparing 4Q17 and 4Q16 for a specific company in terms of calculation. Events such as the merger between Energy Transfer (ETP) and Sunoco Logistics Partners (Former Ticker: SXL), which closed in April 2017, will impact comparability.

This is the image alt text

What conclusions can we draw?

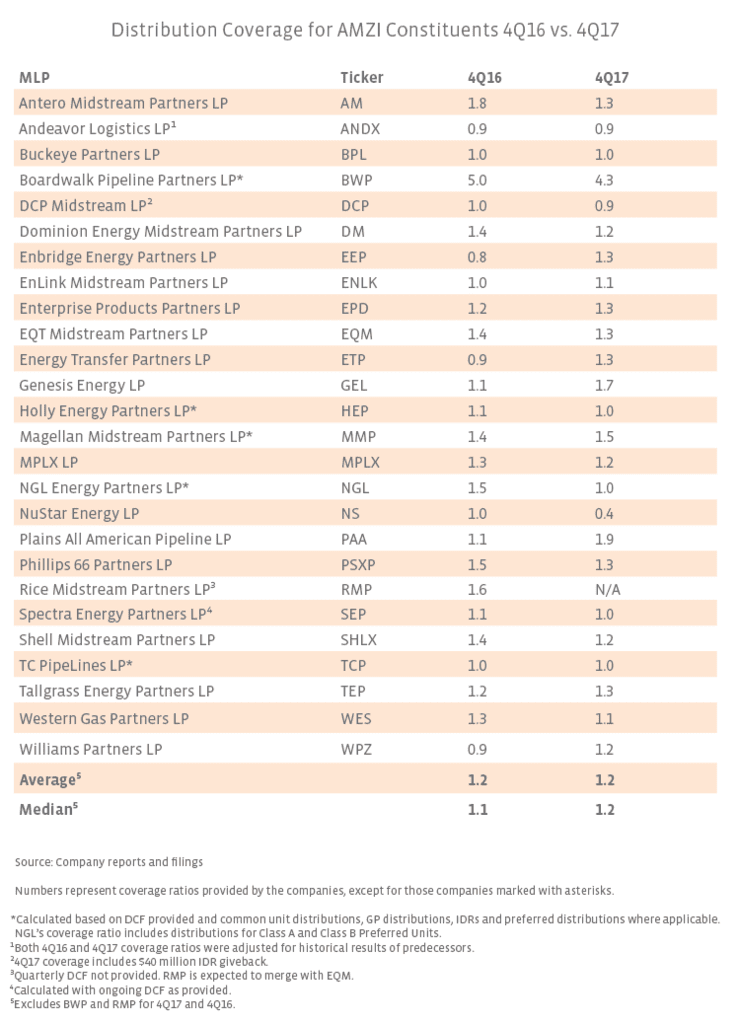
For the group as a whole, coverage ratios appear to be healthy, or at least, comfortable. Interestingly, the average is consistent across the two periods, though certainly there are shifts for individual companies. Those MLPs that have guided to steeper distribution growth have seen a decrease in their coverage ratios from 4Q16 to 4Q17, including Shell Midstream Partners (SHLX), Antero Midstream Partners (AM), Phillips 66 Partners (PSXP) and Dominion Energy Partners (DM). These four MLPs have incentive distribution rights (IDRs), which results in higher payments to the general partner as the distribution grows (increasing the denominator in the coverage ratio calculation). Despite the decrease in coverage on a year-over-year basis, all four names were at or above the average for the group for 4Q17.

MLPs with distribution cuts since 4Q16, namely Genesis Energy (GEL), Plains All American (PAA) and Enbridge Energy Partners (EEP), show a notable improvement in coverage ratio from 4Q16 to 4Q17 as one would expect. NuStar Energy (NS) had the lowest distribution coverage ratio for 4Q17 and has already announced a distribution cut for 1Q18. Boardwalk Pipeline Partners’ (BWP) lofty coverage ratio is an outlier (and thus excluded from the average and median) but makes sense given its distribution run rate of $0.10 per unit since its 4Q13 distribution. Coverage ratios should directionally improve for companies pursuing self-funding and more moderate distribution growth, such as Enterprise Products Partners (EPD). Magellan Midstream Partners’ (MMP) relatively strong coverage ratio in both periods, similarly fits with its history of self-funding the equity portion of its capital.

Bottom Line

Coverage ratios will remain dynamic as individual MLPs shift towards self-funding and as high-growing MLPs mature. Admittedly, we’ve just provided a small snapshot of coverage ratios (26 out of 102 MLPs), however these names make up 69% of the total energy MLP market capitalization metric. Aside from NS, which has already announced a distribution cut, the data doesn’t appear to raise any red flags for AMZI constituents. Rather, hopefully it does the opposite and gives midstream MLP investors some peace of mind.


Content continues below advertisement

» Popular Pages

  • Tickers
  • Articles

Sep 28

Andrew Beer: Avoid the “Worst Heuristic Bias” in Investing

Sep 28

Today's Economy is a Gift to High Yield

Sep 28

The Quality Dividend ETF OUSM Is Nearing RSI Signal

Sep 28

BlackRock Lists Active Equity Premium Income ETF

Sep 28

Examining the Women Factor

Sep 28

Rising Water Costs Globally Spell Opportunity for This ETF

Sep 28

Harbor Commodity ETF Supported by Strong Tilt Toward Energy

Sep 28

VanEck Ethereum Futures ETF Could Launch Soon

Sep 28

Avantis Launches U.S. Large Cap Equity ETF

Sep 28

Capital Group Launches 5 New Active ETFs

QQQ

Invesco QQQ Trust Series I

SPY

SPDR S&P 500 ETF Trust

VOO

Vanguard S&P 500 ETF

JEPI

JPMorgan Equity Premium...

TLT

iShares 20+ Year Treasury...

VGT

Vanguard Information...

SCHD

Schwab US Dividend Equity ETF...

VTI

Vanguard Total Stock Market...

SDS

ProShares UltraShort S&P500

XLK

Technology Select Sector SPDR...

Loading Articles...
Our Sites
  • VettaFi
  • Advisor Perspectives
  • ETF Trends
Tools
  • ETF Screener
  • Mutual Fund to ETF Converter
  • Head-To-Head ETF Comparison
  • ETF Country Exposure Tool
  • ETF Stock Exposure Tool
  • ETF Database Pro
More Tools
  • Financial Advisor & RIA Center
Explore ETFs
  • ETF News
  • ETF Category Reports
  • Premium Articles
  • Alphabetical Listing of ETFs
  • Browse ETFs by ETF Database Category
  • Browse ETFs by Index
  • Browse ETFs by Issuer
  • Compare ETFs
Information
  • Contact Us
  • Terms of Use and Privacy Policy
  • © 2023 VettaFi LLC. All rights reserved.

Advertisement

Is Your Portfolio Positioned With Enough Global Exposure?

ETF Education Channel

How to Allocate Commodities in Portfolios

Tom LydonApr 26, 2022
2022-04-26

A long-running debate in asset allocation circles is how much of a portfolio an investor should...

Core Strategies Channel

Why ETFs Experience Limit Up/Down Protections

Karrie GordonMay 13, 2022
2022-05-13

In a digital age where information moves in milliseconds and millions of participants can transact...

}
X