ETFdb Logo
ETFdb Logo
  • ETF Database
  • Channels
    • Themes
      • Active ETF
      • Artificial Intelligence
      • Beyond Basic Beta
      • China Insights
      • Climate Insights
      • Core Strategies
      • Crypto
      • Direct Indexing
      • Disruptive Technology
      • Energy Infrastructure
      • ETF Building Blocks
      • ETF Investing
      • ETF Education
      • ETF Strategist
      • Financial Literacy
      • Fixed Income
      • Free Cash Flow
      • Innovative ETFs
      • Institutional Income Strategies
      • Leveraged & Inverse
      • Managed Futures
      • Market Insights
      • Modern Alpha
      • Multifactor
      • Responsible Investing
      • Retirement Income
      • Tax Efficient Income
    • Asset Class
      • Equity
        • U.S. Equity
        • Int'l Developed
        • Emerging Market Equities
      • Alternatives
        • Commodities
        • Gold/Silver/Critical Minerals
        • Currency
        • Volatility
      • Fixed Income
        • Investment Grade Corporates
        • US Treasuries & TIPS
        • High Yield Corporates
        • Int'l Fixed Income
    • ETF Ecosystem
    • ETFs in Canada
  • Tools
    • ETF Screener
    • ETF Country Exposure Tool
    • ETF Sector Tracker Tool
    • ETF Database Categories
    • Head-To-Head ETF Comparison Tool
    • ETF Stock Exposure Tool
    • ETF Issuer Fund Flows
    • Indexes
    • Mutual Fund To ETF Converter
  • Research
    • ETF Education
    • Equity Investing
    • Dividend ETFs
    • Leveraged ETFs
    • Inverse ETFs
    • Index Education
    • Index Insights
    • Top ETF Sectors
    • Top ETF Issuers
    • Top ETF Industries
  • Webcasts
  • Themes
    • AI ETFs
    • Blockchain ETFs
    • See all Thematic Investing ETF themes
    • ESG Investing
    • Marijuana ETFs
  • Multimedia
    • ETF 360 Video Series
    • ETF of the Week Podcast
    • ETF Prime Podcast
    • Video
  • Company
    • About VettaFi
    • Get VettaFi’ed
  • PRO
    • Pro Content
    • Pro Tools
    • Advanced
    • FAQ
    • Pricing
    • Free Sign Up
    • Login
  1. Index Insights
  2. Distribution Growth Reveals that MLPs are Becoming a Mature, Not Emerging, Asset Class
Index Insights
Share

Distribution Growth Reveals that MLPs are Becoming a Mature, Not Emerging, Asset Class

Maria HalmoMay 04, 2016
2016-05-04

Let’s face it: investors are obsessed with MLP distributions and distribution growth. This obsession has its roots in the history of frequent double digit distribution growth for the space—one of the hallmarks of an emerging asset class. Other arguments that have been previously used to define MLPs as an emerging asset class include that ten years ago, not only were MLPs relatively unknown, there were few MLP investment options, creating even more inefficiencies. Now, there are nearly as many MLP investment products as there are MLPs. Also unlike ten years ago, not only are MLPs quite popular, they even make national news on occasion. Today, we look at slowing or plateauing growth, one of the characteristics of a maturing asset class; while most asset classes use revenues and sales as a measure of growth, for MLPs, we’ll use distributions to measure growth.

Anyone considering an MLP investment almost certainly still has distributions at the top of their list. However, given the growth in the space over the past decade, as well as the compositional changes to the asset class, can and should investors continue to expect distribution growth as constant as receiving a Schedule K-1?

This is the image alt text

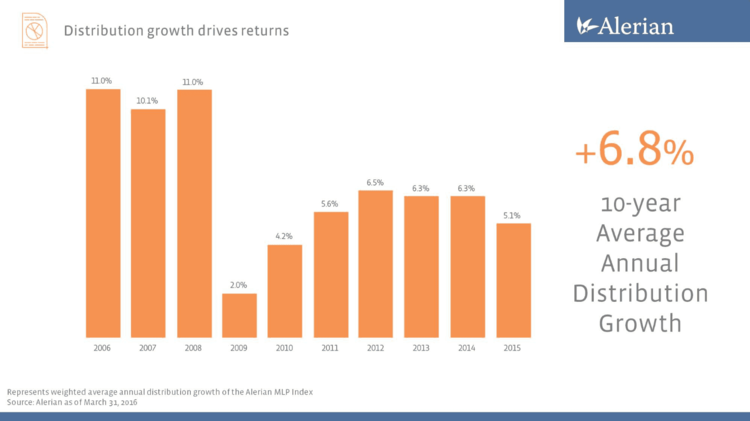
Alerian’s annual distribution chart (reproduced above) is perhaps our most popular chart ever. These numbers are all weighted averages by market cap, which means that Enterprise Products Partners (EPD) will have a heavy influence, but the smaller names (often with larger distribution growth) may not make much of an impact overall. For example, NGL Energy Partners (NGL) has a market cap of just $1.3 billion (giving it about a 0.5% weight in the AMZ), but raised its distribution by over 10% last year. Even so, investors are also appropriately concerned about a headline where any MLP has cut its distribution. We decided to make a series of histograms to see just how many MLPs raised their distributions by how much in the past decade.

The method for this study considered only those MLPs which intended to pay a stable distribution (ie, no variable distributors), and we also excluded the MLP GPs. For a company to be included, it needed to be trading for two full calendar years so we could measure annual distribution growth. Then, for example: total 2015 distributions are compared to total 2014 distributions to give a 2015 distribution growth number. Please note: this unavoidably introduces some survivorship bias as an MLP in hard times will often be acquired, which would remove it from this study. This method is a bit less complicated than the way Alerian calculates distribution growth in the above chart.

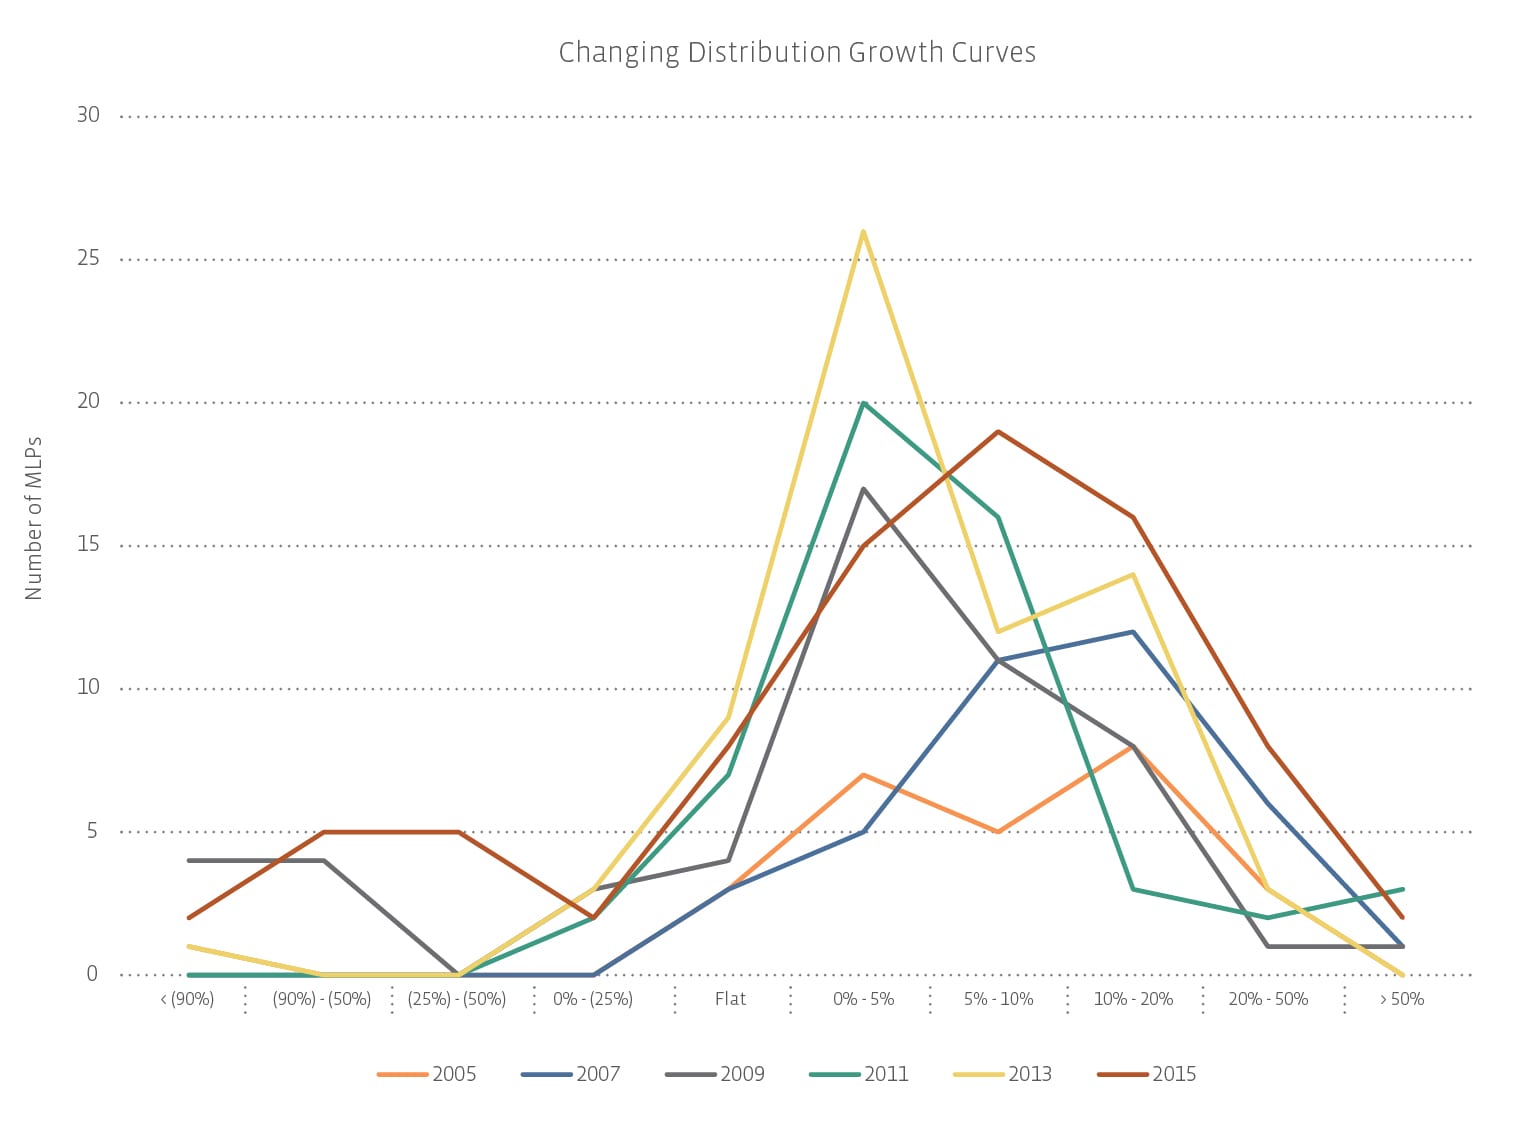
Once the data was compiled, the histogram categories were chosen to be:
(a) cut by more than 90%, which often represents an MLP eliminating its distribution entirely,
(b) a cut of 50%-90%, which is either a very significant cut, or an elimination later in the year,
© a cut of 25%-50%, perhaps indicating those MLPs that just need a bit more wiggle room,
(d) a cut of 25% or less,
(e) 0%, representing those companies which simply maintained distributions,
(f) growth of up to 5%, very common for established MLPs not making large acquisitions,
(g) 5%-10% distribution growth, where the annual weighted average tends to be,
(h) 10%-20%, an exceptional level of growth that can occasionally be maintained for several years for a high growth MLP,
(i) 20%-50% growth, often the result of a transformative transaction or a very generous GP
(j) growth of more than 50%, which is most often an MLP that previously cut its distribution reinstating it. Not always, though. In 2015, Tallgrass Energy Partners (TEP), thanks to its GP, was able to grow the distribution 52.8%.


Content continues below advertisement

distribution_growth_histograms__1_-01

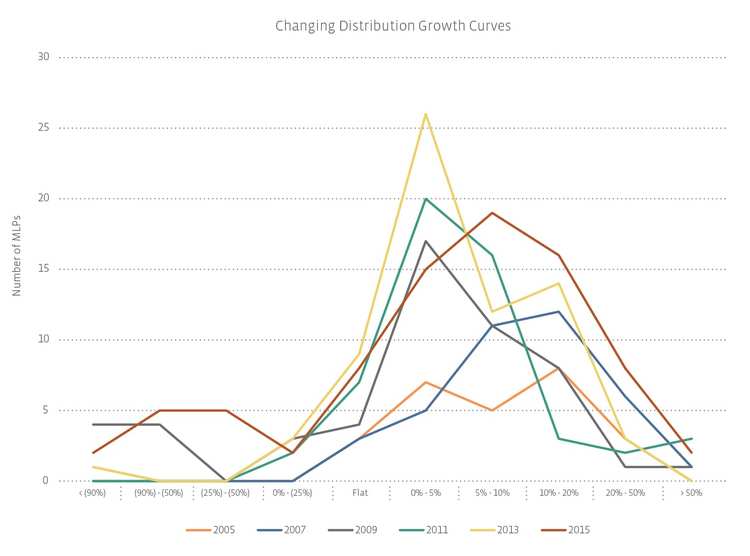
What we found was that in the early years 2005-2008, distribution cuts were exceptionally rare and a plurality of MLPs actually grew their distributions in the 10%-20% range. An MLP was considerably more likely to grow its distribution by more than 20% than it was to cut the distribution.

Starting with 2009, the peak shifted downward, and the majority of MLPs raised their distribution by less than 5% each year. Of course, the two most difficult years, 2009 and 2015, also saw the most distribution cuts.

More recently, starting around 2012, as the number of MLPs continued to grow, the roughly normal distribution curve started to disappear. In 2012, the most common thing was to raise your distribution by 5% or less, or by 10%-20%. Same thing in 2013—the chart shows two peaks (the best fit line actually looked like a great sled riding hill). Some MLPs have matured and are now growing distributions in the stately low single digits, while other, newly formed MLPs are still experiencing new, early, and quite high growth. There are slightly fewer companies in between these options.

In 2015, one can perhaps see a Gaussian (or normal) distribution curve, but the tail risk is much fatter. In fact, as the number and variety of MLPs grows, so does the variety of distribution growth numbers.

Taken as a whole, the weighted average distribution growth has fallen, the histogram peak has shifted to the left, and the diversity of distribution growths all speak to an asset class that, at least in terms of its distribution growth, has been quietly maturing for the past several years.

With an emerging asset class, picking a winner is often as easy as one of those children’s balloon dart games at the carnival: everyone’s a winner! As we grow older, the games become more difficult and everyone does not win, and yet, the rewards are often just as valuable. Investors may not be able to expect standard double-digit distribution growth from MLPs anymore (well, at least not without a strong GP or aggressive appetite for M&A). More and more MLPs are keeping distributions flat, which doesn’t mean that it’s impossible to pick a winner, only that, unlike ten years ago, it’s just much harder to do.

» Popular Pages

  • Tickers
  • Articles

Sep 28

Andrew Beer: Avoid the “Worst Heuristic Bias” in Investing

Sep 28

Today's Economy is a Gift to High Yield

Sep 28

The Quality Dividend ETF OUSM Is Nearing RSI Signal

Sep 28

BlackRock Lists Active Equity Premium Income ETF

Sep 28

Examining the Women Factor

Sep 28

Rising Water Costs Globally Spell Opportunity for This ETF

Sep 28

Harbor Commodity ETF Supported by Strong Tilt Toward Energy

Sep 28

VanEck Ethereum Futures ETF Could Launch Soon

Sep 28

Avantis Launches U.S. Large Cap Equity ETF

Sep 28

Capital Group Launches 5 New Active ETFs

QQQ

Invesco QQQ Trust Series I

SPY

SPDR S&P 500 ETF Trust

VOO

Vanguard S&P 500 ETF

JEPI

JPMorgan Equity Premium...

TLT

iShares 20+ Year Treasury...

VGT

Vanguard Information...

SCHD

Schwab US Dividend Equity ETF...

VTI

Vanguard Total Stock Market...

SDS

ProShares UltraShort S&P500

XLK

Technology Select Sector SPDR...

Loading Articles...
Our Sites
  • VettaFi
  • Advisor Perspectives
  • ETF Trends
Tools
  • ETF Screener
  • Mutual Fund to ETF Converter
  • Head-To-Head ETF Comparison
  • ETF Country Exposure Tool
  • ETF Stock Exposure Tool
  • ETF Database Pro
More Tools
  • Financial Advisor & RIA Center
Explore ETFs
  • ETF News
  • ETF Category Reports
  • Premium Articles
  • Alphabetical Listing of ETFs
  • Browse ETFs by ETF Database Category
  • Browse ETFs by Index
  • Browse ETFs by Issuer
  • Compare ETFs
Information
  • Contact Us
  • Terms of Use and Privacy Policy
  • © 2023 VettaFi LLC. All rights reserved.

Advertisement

Is Your Portfolio Positioned With Enough Global Exposure?

ETF Education Channel

How to Allocate Commodities in Portfolios

Tom LydonApr 26, 2022
2022-04-26

A long-running debate in asset allocation circles is how much of a portfolio an investor should...

Core Strategies Channel

Why ETFs Experience Limit Up/Down Protections

Karrie GordonMay 13, 2022
2022-05-13

In a digital age where information moves in milliseconds and millions of participants can transact...

}
X