Summary:
- With many Americans working from home, demand for gasoline and jet fuel is falling significantly, while diesel demand remains more resilient.
- With reduced demand, particularly for gasoline, refiners need to reduce processing rates to avoid producing an excess of refined products. Refinery utilization fell to 75.6% last week.
- With new weekly storage capacity utilization data introduced for the first time yesterday, market watchers will be better able to gauge how much slack is in the system to absorb rising crude inventories.
One of the underappreciated luxuries of analyzing US oil markets is weekly data on inventories, imports, exports, refining utilization, production, demand and more from the Energy Information Administration’s (EIA) Weekly Petroleum Status Report. In response to requests and in acknowledging the unprecedented oil market environment, the EIA has also rolled out new weekly storage capacity estimates by region. Yesterday’s report, which includes data as of April 3, is packed with interesting takeaways related to reduced demand stemming from coronavirus. This piece briefly touches on some of these trends.
Demand – With many Americans working from home and avoiding travel, demand for gasoline and jet fuel is falling significantly. Gasoline demand was 6.6 million barrels per day (MMBpd) last week – down 27% from 9.1 MMBpd the same week last year. Similarly, jet fuel demand was down 29% from the same week last year. On the other hand, distillate (diesel) demand has been much more resilient and was only down 6% from last year. This aligns with comments from a March 24 update call from refiner Phillips 66 (PSX), which talked about 20-30% demand destruction for gasoline and a much lower impact to diesel as trucks remain on the road.
Refining and Production of Petroleum Products – With reduced demand, particularly for gasoline, refiners need to reduce processing rates to avoid producing an excess of gasoline. Refining utilization last week fell to 75.6% from 82.3% the prior week. Normally, refining utilization at this time of year would be in the high 80s. Gasoline production fell to 5.8 MMBpd last week, down from 10.1 MMBpd the same week last year. Jet fuel production was also cut in half year-over-year. With lower utilization, one would expect distillate production to be down as well. However, distillate production was actually up from the prior week (ended March 27) and down only 1% from this time last year. How can that be? Refineries generally have some ability to swing their fuel production towards the most favorable products. For example, on their update call, PSX management indicated that they could flex half of their 225,000 barrels per day of jet production to gasoline or diesel. To the extent possible, refiners are likely shifting to maximize diesel in favor of gasoline and jet fuel.
Production – Weekly oil production numbers should be taken with a grain of salt. Monthly production data from the EIA is more reliable, and even that data is subject to significant revisions. The oil production numbers are explicitly estimates based on short-term forecasts for Lower 48 production and estimated Alaskan production rounded to the nearest 100,000 barrels per day. Oil production for the US was estimated at 12.4 MMBpd last week, down 600,000 barrels per day from the estimate for the week ended March 27. On Tuesday, the EIA updated its Short-Term Energy Outlook, forecasting a decline in full-year 2020 US production of 0.5 MMBpd to 11.8 MMBpd on average for the year. These forecasts do not incorporate OPEC+ cuts (i.e. Brent oil price forecast for 2020 is $33 per barrel), but a cut agreement would be reflected in future releases if confirmed. OPEC and its counterparts are meeting today to discuss potential production cuts.
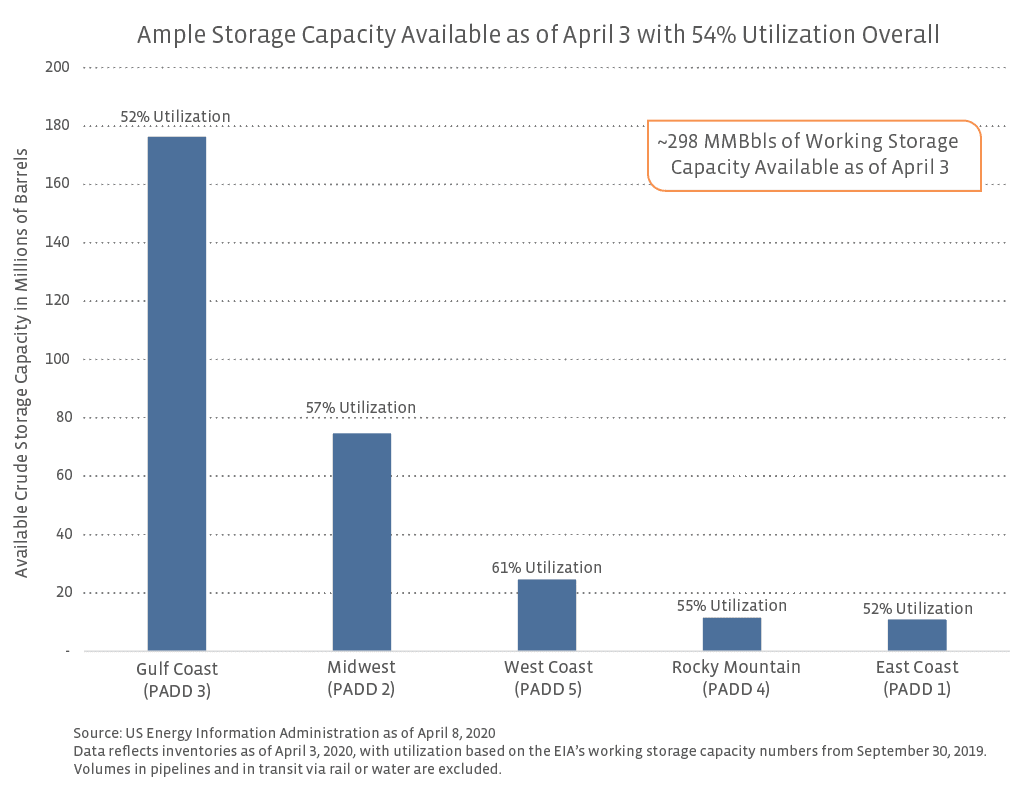
Storage – As discussed last week, storage has become a hot topic given the steep decline in demand and the momentum behind production. Last week, US crude inventories jumped by 15.2 million barrels (MMBbls) and sit ~2% above their five-year average for this part of the year. With new weekly storage capacity utilization data introduced for the first time yesterday, market watchers will be better able to gauge how much slack is in the system to absorb rising crude inventories. The chart below shows how much working storage capacity is available in each region of the US and capacity utilization.


