ETFdb Logo
ETFdb Logo
  • ETF Database
  • Channels
    • Themes
      • Active ETF
      • Artificial Intelligence
      • Beyond Basic Beta
      • China Insights
      • Climate Insights
      • Core Strategies
      • Crypto
      • Direct Indexing
      • Disruptive Technology
      • Energy Infrastructure
      • ETF Building Blocks
      • ETF Investing
      • ETF Education
      • ETF Strategist
      • Financial Literacy
      • Fixed Income
      • Free Cash Flow
      • Innovative ETFs
      • Institutional Income Strategies
      • Leveraged & Inverse
      • Managed Futures
      • Market Insights
      • Modern Alpha
      • Multifactor
      • Responsible Investing
      • Retirement Income
      • Tax Efficient Income
    • Asset Class
      • Equity
        • U.S. Equity
        • Int'l Developed
        • Emerging Market Equities
      • Alternatives
        • Commodities
        • Gold/Silver/Critical Minerals
        • Currency
        • Volatility
      • Fixed Income
        • Investment Grade Corporates
        • US Treasuries & TIPS
        • High Yield Corporates
        • Int'l Fixed Income
    • ETF Ecosystem
    • ETFs in Canada
  • Tools
    • ETF Screener
    • ETF Country Exposure Tool
    • ETF Sector Tracker Tool
    • ETF Database Categories
    • Head-To-Head ETF Comparison Tool
    • ETF Stock Exposure Tool
    • ETF Issuer Fund Flows
    • Indexes
    • Mutual Fund To ETF Converter
  • Research
    • ETF Education
    • Equity Investing
    • Dividend ETFs
    • Leveraged ETFs
    • Inverse ETFs
    • Index Education
    • Index Insights
    • Top ETF Sectors
    • Top ETF Issuers
    • Top ETF Industries
  • Webcasts
  • Themes
    • AI ETFs
    • Blockchain ETFs
    • See all Thematic Investing ETF themes
    • ESG Investing
    • Marijuana ETFs
  • Multimedia
    • ETF 360 Video Series
    • ETF of the Week Podcast
    • ETF Prime Podcast
    • Video
  • Company
    • About VettaFi
    • Get VettaFi’ed
  • PRO
    • Pro Content
    • Pro Tools
    • Advanced
    • FAQ
    • Pricing
    • Free Sign Up
    • Login
  1. Index Insights
  2. Examining Past MLP Sell-Offs and Recoveries
Index Insights
Share

Examining Past MLP Sell-Offs and Recoveries

Stacey Morris, CFAApr 13, 2020
2020-04-13
Past performance does not mean anything for future performance as practically every piece of financial collateral will remind you. However, it can be informative to look at historical MLP sell-offs to get a sense for how the space has recovered in the past. Today’s note examines the forward three-month, one-year, and three-year returns for the 
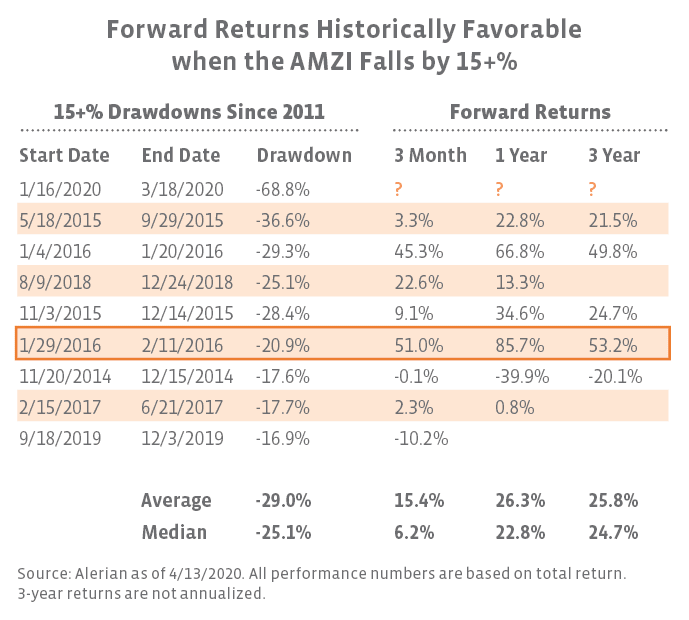
Alerian MLP Infrastructure Index (AMZI) for instances when the index has fallen by 15% or more on a total-return basis from relative peak to relative trough going back to 2011. This simplistic approach is meant only to provide context, not predictions. The table of AMZI drawdowns and recoveries below offers several interesting data points. In the eight occurrences when the AMZI has fallen by more than 15% on a total-return basis, the average forward three-month total return is 15.4%, and returns have been positive 75% of the time. The average one-year total return has been 26.3%, and the three-year return has averaged 25.8%. Forward one-year returns have been positive six out of seven times (85.7%), and forward three-year returns have been positive four out of five times (80%). The single instance when forward one-year and three-year returns were negative corresponded to the AMZI’s relative bottom on December 15, 2014. At that time, West Texas Intermediate (WTI) oil prices traded at $56 per barrel (bbl) and were more than a year away from their relative bottom in February 2016. The forward one-year and three-year losses were admittedly significant at ~40% and ~20%, respectively. Many investors have looked back to 2014-2016 as a reference ( read more) for today’s environment given that WTI oil prices bottomed at $26/bbl in February 2016. In contrast to 2020, there was a slow grind lower from oil’s relative peak in the summer of 2014 to its bottom. The strongest forward returns in the table followed weak performance in early 2016 that coincided with oil’s relative low on February 11, which also marked a relative low in the AMZI (see row in orange box). In just three months, the AMZI had gained 51.0%, and a year later, the total return was almost 86%. However, the three-year return was flat with the three-month return. In 2020, the price move in oil and MLPs has been quick and drastic with the unprecedented demand impact from COVID-19 exacerbated by an oil price war that has finally been resolved with agreed production cuts. Each sell-off and recovery is unique, and the shape of the recovery for MLPs this time around could be swift as seen in 2016 or a slow grind. Through April 9, less than a month from the relative bottom, the AMZI had already gained over 40% on a price-return basis. However, considering the magnitude of the recent sell-off, there is still much ground to regain for a true recovery to be realized.
This is the image alt text


Content continues below advertisement

» Popular Pages

  • Tickers
  • Articles

Sep 29

A Fixed Income Primer for Constructing Portfolios

Sep 29

Main Management Market Note: September 29, 2023

Sep 29

Higher for Much Longer?

Sep 29

Moving Averages: S&P Ends September Down 4.9%

Sep 29

This Week in ETFs: FormulaFolios Renamed & Adds New Funds

Sep 29

Play Online Car Sales News in These 2 China ETFs

Sep 29

SEC Opens Ethereum Futures ETF Floodgates

Sep 29

VettaFi Voices On: Managing Risk in an Uncertain Economy

Sep 29

SPYI Outperforms SPY in Challenging 3rd Quarter

Sep 29

More Rate Hikes? Watch Treasury ETF USFR

QQQ

Invesco QQQ Trust Series I

SPY

SPDR S&P 500 ETF Trust

VOO

Vanguard S&P 500 ETF

JEPI

JPMorgan Equity Premium...

TLT

iShares 20+ Year Treasury...

SCHD

Schwab US Dividend Equity ETF...

SMH

VanEck Semiconductor ETF

VGT

Vanguard Information...

VTI

Vanguard Total Stock Market...

XLK

Technology Select Sector SPDR...

Loading Articles...
Our Sites
  • VettaFi
  • Advisor Perspectives
  • ETF Trends
Tools
  • ETF Screener
  • Mutual Fund to ETF Converter
  • Head-To-Head ETF Comparison
  • ETF Country Exposure Tool
  • ETF Stock Exposure Tool
  • ETF Database Pro
More Tools
  • Financial Advisor & RIA Center
Explore ETFs
  • ETF News
  • ETF Category Reports
  • Premium Articles
  • Alphabetical Listing of ETFs
  • Browse ETFs by ETF Database Category
  • Browse ETFs by Index
  • Browse ETFs by Issuer
  • Compare ETFs
Information
  • Contact Us
  • Terms of Use and Privacy Policy
  • © 2023 VettaFi LLC. All rights reserved.

Advertisement

Is Your Portfolio Positioned With Enough Global Exposure?

ETF Education Channel

How to Allocate Commodities in Portfolios

Tom LydonApr 26, 2022
2022-04-26

A long-running debate in asset allocation circles is how much of a portfolio an investor should...

Core Strategies Channel

Why ETFs Experience Limit Up/Down Protections

Karrie GordonMay 13, 2022
2022-05-13

In a digital age where information moves in milliseconds and millions of participants can transact...

}
X