ETFdb Logo
ETFdb Logo
  • ETF Database
  • Channels
    • Themes
      • Active ETF
      • Artificial Intelligence
      • Beyond Basic Beta
      • China Insights
      • Climate Insights
      • Core Strategies
      • Crypto
      • Direct Indexing
      • Disruptive Technology
      • Energy Infrastructure
      • ETF Building Blocks
      • ETF Investing
      • ETF Education
      • ETF Strategist
      • Financial Literacy
      • Fixed Income
      • Free Cash Flow
      • Innovative ETFs
      • Institutional Income Strategies
      • Leveraged & Inverse
      • Managed Futures
      • Market Insights
      • Modern Alpha
      • Multifactor
      • Responsible Investing
      • Retirement Income
      • Tax Efficient Income
    • Asset Class
      • Equity
        • U.S. Equity
        • Int'l Developed
        • Emerging Market Equities
      • Alternatives
        • Commodities
        • Gold/Silver/Critical Minerals
        • Currency
        • Volatility
      • Fixed Income
        • Investment Grade Corporates
        • US Treasuries & TIPS
        • High Yield Corporates
        • Int'l Fixed Income
    • ETF Ecosystem
    • ETFs in Canada
  • Tools
    • ETF Screener
    • ETF Country Exposure Tool
    • ETF Sector Tracker Tool
    • ETF Database Categories
    • Head-To-Head ETF Comparison Tool
    • ETF Stock Exposure Tool
    • ETF Issuer Fund Flows
    • Indexes
    • Mutual Fund To ETF Converter
  • Research
    • ETF Education
    • Equity Investing
    • Dividend ETFs
    • Leveraged ETFs
    • Inverse ETFs
    • Index Education
    • Index Insights
    • Top ETF Sectors
    • Top ETF Issuers
    • Top ETF Industries
  • Webcasts
  • Themes
    • AI ETFs
    • Blockchain ETFs
    • See all Thematic Investing ETF themes
    • ESG Investing
    • Marijuana ETFs
  • Multimedia
    • ETF 360 Video Series
    • ETF of the Week Podcast
    • ETF Prime Podcast
    • Video
  • Company
    • About VettaFi
    • Get VettaFi’ed
  • PRO
    • Pro Content
    • Pro Tools
    • Advanced
    • FAQ
    • Pricing
    • Free Sign Up
    • Login
  1. Index Insights
  2. Getting What You Pay For: How Top Distribution Growers Reward Their CEOs
Index Insights
Share

Getting What You Pay For: How Top Distribution Growers Reward Their CEOs

Maria HalmoApr 14, 2016
2016-04-14

Wanna Make a Minimum of $500,000 Per Year?
Americans are pretty tight-lipped about how much they make. The social taboo against discussing salaries, bonuses, and compensation has led to some pretty surprising discrepancies, but to many people’s surprise, the compensation of the executive suite of public companies is publicly available. (That’s how we know Rex Tillerson, CEO of Exxon (XOM), made $27.3 million last year.) It’s listed in 10-k filings, or at worst, in the proxy statements—all of which are legally required to be filed with the SEC.

The executive compensation section will also list how compensation is determined. Not only is compensation broken out by salary vs bonus vs other, and cash vs units, the metrics used for awarding bonuses are also listed. Here at Alerian, we are delighted (and impressed) that both EnLink Midstream Partners (ENLK) and Amerigas Partners (APU) use the Alerian MLP Index (AMZ) as a comparative metric in determining how well their stock has done in comparison to peers, which is directly linked to how much their executives should be paid.

Privately, I use this data to wonder about how to get a job as an MLP executive (and dream about the vacation homes I will buy), but pertinently, in a year when the AMZ fell more than 30% even on a total return basis, how much did those CEOs make? Are they fat cats working for Daddy’s company who get paid regardless of company performance or how much golf they play on company time? Or, are they titans of industry appropriately making themselves rich as they make investors rich? This week, we’ll focus on those MLPs which outperformed in 2015, and see how much their CEOs were compensated for finding success in such a difficult environment.

Outperform Your Peers on Distribution Growth
Investors are often surprised to realize that in 2015, despite persistent headlines about distribution cuts, the companies in the AMZ grew their distributions by 5.1%. This is a weighted average number which Karyl Patredis explains in great detail. To determine individual MLP growth, we used the simpler method of how much total 2015 distributions grew for a company compared to 2014 distributions. Using this method, at least a dozen MLPs grew their distributions by double digits. However, the faraway champion of 2015 distribution growth was Tallgrass Energy Partners (TEP), which increased payments to unitholders by 52.8%!

TEP’s President and CEO, David Dehaemers Jr, received the same salary in 2014 as in 2015 (namely, $300,000). But his bonus in 2015 was $601,000, over twice his salary. On a total compensation metric, he got paid 59.5% more in 2015 than in 2014. [As a side note, the other TEP executives had total compensation increases of around 6% for 2015, but each of their 2014 bonuses was double Dehaemers’. Full details can be found in TEP’s 10-k.]

Salaries are typically paid in cash (well, direct deposit, I’m assuming) and are designed to be industry competitive, but stable over time. Bonuses (cash or equity) and long-term incentive plans are performance-driven and often form the majority of a successful team’s compensation. The amounts are often decided by some combination of metrics laid out in the 10-k, the CEO, the board, or a compensation consultant. Frequently, there is a peer group listed in the 10-k to be sure the executive is being paid in line with industry standards. Or, the peer group will be used as a comparison, to see how well the company (and CEO) has done comparatively.

The above paragraph lists only general trends and should in no way lull you into believing that CEO compensation metrics are standardized by any means. The chart below shows only the total compensation, but each form of compensation varies significantly between companies.

The CEO of EQT Midstream Partners (EQM), David Porges, is also the CEO of all the other EQT entities, and the compensation listed below is his total compensation, not just the EQM portion. That’s why it looks like he earned more than double any other listed CEO. (The 10-k is fascinating in its breakout not only of forms of compensation, but it turns out that being an executive really does come with perks like the company paying for your country club dues.)

CEO Compensation Table Rev 1

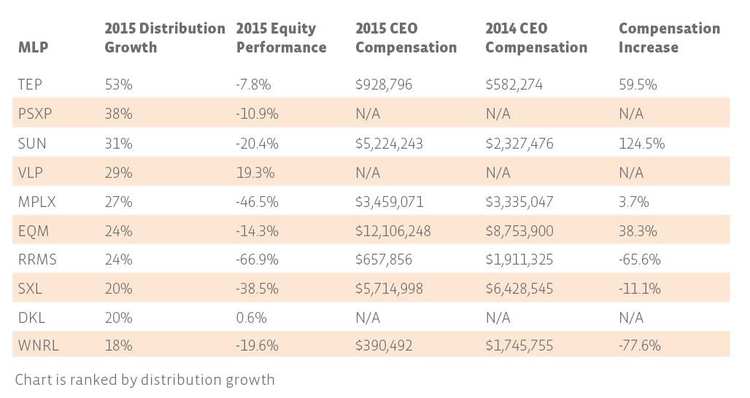
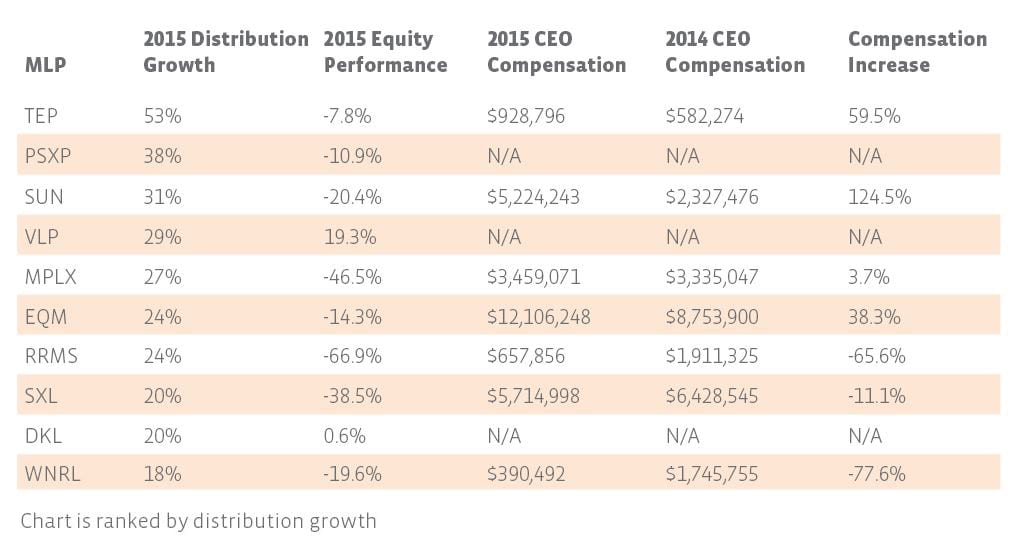
In regards to the lack of reported compensation by Phillips 66 Partners (PSXP): due to its relationship with Philips 66 (PSX), CEO Greg Garland devotes only a small part of his working time to the MLP. As such, his compensation from the MLP is not material to his overall compensation. Like PXSP, the executive officers of Valero Energy Partners (VLP), including CEO Joseph Gorder, spend only a portion of their time working for the MLP. Ditto for Delek Logistics Partners (DKL). However, executives of VLP and DKL are eligible to receive MLP-unit-based awards under the long term incentive plan, although no awards were granted in 2015.

Is that unfair? Potentially. But one reason (perhaps even the main reason) all but one of the ten listed companies have been able to increase their distributions so much is because of the drop-down relationship with their parent companies. If the MLP has been engineered, even before IPO, in such a way as to grow the distribution by double digits via scheduled dropdown assets from the parent, should a CEO get credit for that growth?

While the dropdown stories have all shown remarkable distribution increases, few of them have been rewarded in the market. Part of that is changing forward expectations for the entire energy space, but at the same time, communication with the markets and investors is one of the (unwritten) responsibilities of the CEO. This makes it all the more unfortunate that VLP and DKL (the companies with positive equity performance) do not have pure MLP compensation information.

The only non-dropdown story is Sunoco Logistics Partners (SXL), although its general partner is owned by Energy Transfer Partners (ETP). The growth projects it pursued have been nearly entirely organic, and while it has partnered with other companies, including ETP, the success has not relied on the relationship with the parent.

Far from having a hands-off GP, in the case of Rose Rock Midstream Partners (RRMS), executive compensation is decided by the parent company, SemGroup (SEMG), although the MLP does decide the unit-based awards. The compensation for CEO Carlin Conner in 2014 involves his $108k signing bonus, as he began work in April of that year, as well as SemGroup stock issued to him. Unfortunately, the 10-k provides no further details as to the decrease in his overall compensation, but the percentage change is quite similar to the drop in the price of RRMS units.

As implied above, the chart cannot include all relevant details without being footnoted into oblivion. The CEO of Sunoco LP (SUN), Bob Owens, appears to have been given a stunning raise, but for the purposes of reporting SUN compensation, he was only CEO of SUN for part of 2014, due to the merger of Susser Holdings (former ticker: SUSS) that year with ETP. It’s all a little confusing, but the important point is that Owens’ reported 2014 compensation does not represent a full year’s compensation.

The Plural of Anecdote Is Not Data
I could go on, explaining MPLX (MPLX)’s easy-to-follow, yet still quite complicated formulaic method of determining performance-based awards, or how the executives of Western Refining Logistics (WNRL) earn a salary even lower than Rich Kinder’s famous $1/year. All of these stories may be intriguing, in a trivial sort of way, but without a large study, or at least a standardized compensation method across the industry, they remain simply anecdotes.

At the end of the day, CEO compensation is negotiated between a CEO and the company. With billions of units outstanding, even a difference of ten million dollars is unlikely to affect individual unitholders. However, like in all companies, the CEO’s vision, performance, and motivations will absolutely change the course of the MLP over time. There is so much variation in the compensation structures and incentives provided for MLP CEOs that the well-educated investor would be wise to be sure she invests in those MLPs with an incentive structure that suits her portfolio needs.

Just one final example: TEP, while also having the advantages of a parent, also pursued organic growth and third-party acquisitions in 2015. Performance awards (bonuses) for 2015 were based on meeting specific EBITDA, DCF, coverage, and distribution growth goals, all of which were achieved. The specificity of these metrics no doubt contributed to their achievement.


Content continues below advertisement

» Popular Pages

  • Tickers
  • Articles

Sep 27

2 Signs of Stock Market Strength, Courtesy of the Bond Market

Sep 27

Buy on the Dip Prospects: September 27 Edition

Sep 27

Crypto: Bitcoin Unchanged From Last Week

Sep 27

Changing Forces

Sep 27

2 Active ETFs to Help Shield Against Volatility

Sep 27

Evaluating Links Between DEI and Investment Returns

Sep 27

Getting a Pulse on Preferred Stocks

Sep 27

Why Investors Are Gravitating Toward Active Management In 2023

Sep 27

Chart of the Week: Making Tactical Moves With ETFs

Sep 27

Microsoft: Profits Up in the Clouds

QQQ

Invesco QQQ Trust Series I

SPY

SPDR S&P 500 ETF Trust

VOO

Vanguard S&P 500 ETF

XLK

Technology Select Sector SPDR...

JEPI

JPMorgan Equity Premium...

SMH

VanEck Semiconductor ETF

TLT

iShares 20+ Year Treasury...

VGT

Vanguard Information...

VTI

Vanguard Total Stock Market...

SCHD

Schwab US Dividend Equity ETF...

Loading Articles...
Our Sites
  • VettaFi
  • Advisor Perspectives
  • ETF Trends
Tools
  • ETF Screener
  • Mutual Fund to ETF Converter
  • Head-To-Head ETF Comparison
  • ETF Country Exposure Tool
  • ETF Stock Exposure Tool
  • ETF Database Pro
More Tools
  • Financial Advisor & RIA Center
Explore ETFs
  • ETF News
  • ETF Category Reports
  • Premium Articles
  • Alphabetical Listing of ETFs
  • Browse ETFs by ETF Database Category
  • Browse ETFs by Index
  • Browse ETFs by Issuer
  • Compare ETFs
Information
  • Contact Us
  • Terms of Use and Privacy Policy
  • © 2023 VettaFi LLC. All rights reserved.

Advertisement

Is Your Portfolio Positioned With Enough Global Exposure?

ETF Education Channel

How to Allocate Commodities in Portfolios

Tom LydonApr 26, 2022
2022-04-26

A long-running debate in asset allocation circles is how much of a portfolio an investor should...

Core Strategies Channel

Why ETFs Experience Limit Up/Down Protections

Karrie GordonMay 13, 2022
2022-05-13

In a digital age where information moves in milliseconds and millions of participants can transact...

}
X