ETFdb Logo
  • ETF Database
  • Content Hubs
    • Themes
      • Active ETF
      • Alternatives
      • Artificial Intelligence
      • China Insights
      • Core Strategies
      • Crypto
      • Disruptive Technology
      • Energy Infrastructure
      • ETF Building Blocks
      • ETF Investing
      • ETF Strategist
      • Financial Literacy
      • Fixed Income
      • Free Cash Flow
      • Future ETFs
      • Innovative ETFs
      • Institutional Income Strategies
      • Leveraged & Inverse
      • Market Insights
      • Market Outlooks
      • Modern Alpha
      • Nuclear Energy
      • Portfolio Strategies
      • Sector Investing
      • Tax Efficient Income
      • Thematic Investing
    • Asset Class
      • Equity
        • U.S. Equity
        • Int'l Developed
        • Emerging Market Equities
      • Alternatives
        • Gold/Silver/Critical Materials
        • Cryptocurrency
        • Currency
        • Volatility
      • Fixed Income
        • Investment Grade Corporates
        • US Treasuries & TIPS
        • High Yield Corporates
        • Int'l Fixed Income
    • ETF Ecosystem
    • ETFs in Canada
    • Market Outlook
    • Crypto ETF Hub
  • Tools
    • ETF Screener
    • ETF Country Exposure Tool
    • ETF Database Categories
    • Indexes
    • Scenario Analysis
    • Watchlists
    • Head-To-Head ETF Comparison Tool
    • Mutual Fund To ETF Converter
    • ETF Stock Exposure Tool
    • ETF Issuer Fund Flows
  • Research
    • ETF Education
    • Equity Investing
    • Dividend ETFs
    • Leveraged ETFs
    • Inverse ETFs
    • Index Education
    • Index Insights
    • Top ETF Sectors
    • Top ETF Issuers
    • Top ETF Industries
  • Webcasts
  • Sectors
    • Sector Investing Content Hub
    • XLK
    • XLI
    • XLU
    • XLY
    • XLP
    • XLRE
    • Sector Power Rankings
    • XLE
    • XLC
    • XLF
    • XLV
    • XLB
  • Multimedia
    • ETF 360 Video Series
    • ETF of the Week Podcast
    • Gaining Perspective Podcast
    • ETF Prime Podcast
    • Video
  • Company
    • About VettaFi
  • PRO
    • Pro Content
    • Pro Tools
    • Advanced
    • FAQ
    • Free sign up
    • Login
  1. Index Insights
  2. Greatest Hits: MLP Distributions Outpace GDP
Index Insights
Share

Greatest Hits: MLP Distributions Outpace GDP

Maria HalmoSep 09, 2014
2014-09-09

2014.09.10 Greatest Hits - Dist Growth Chart


Alerian is frequently asked to qualify MLP distribution growth numbers. What do they mean in a larger context? How does MLP distribution growth compare to the growth of the broader economy? Is there any correlation between distribution growth and GDP?

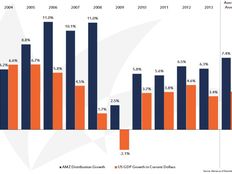
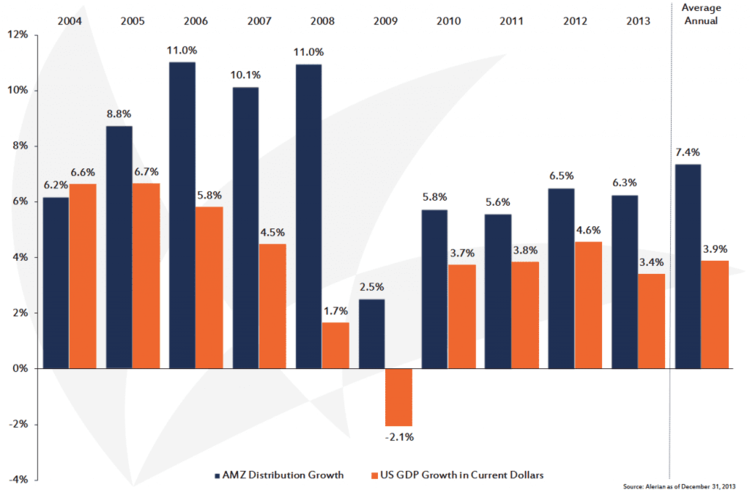
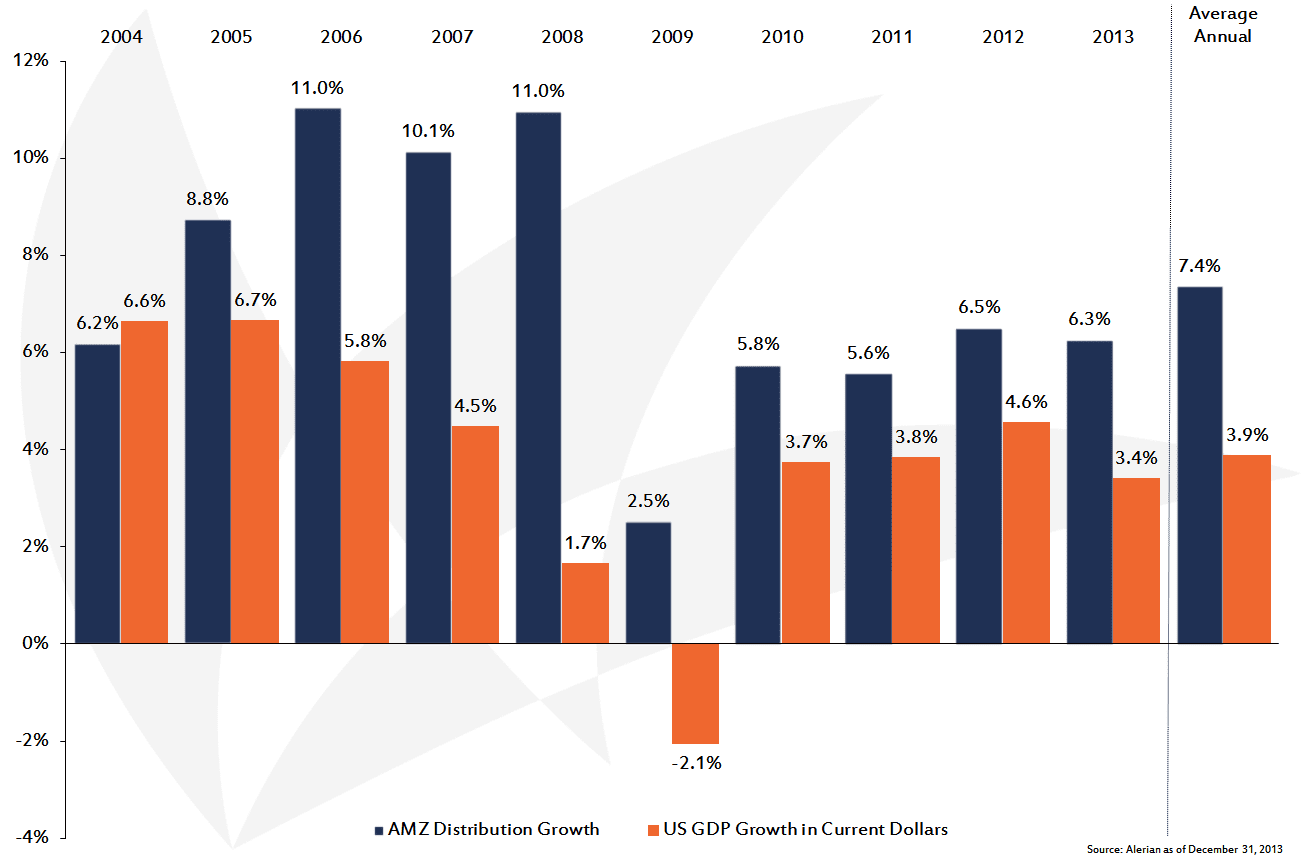
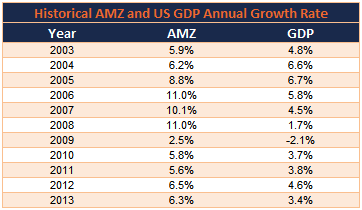
The chart above answers some of those questions. It depicts the weighted average annual distribution growth of the Alerian MLP Index (AMZ) compared against the annual growth of US Gross Domestic Product (GDP) in current dollars. Over the past 10 years, MLP distributions have grown almost twice as fast as the broader economy.


Many investors use MLPs on an ad hoc basis in their search for income. However, distribution growth contributes nearly as much to MLP total returns as the frequently cited MLP yield. Successful MLPs are able to grow their distributions quarter after quarter regardless of the broader macro environment. During the 2005-2008 time period, average distribution growth rates of 9%-11% were driven by the number of MLPs which had their IPOs in that period. Smaller companies have a relatively easier time achieving above-average growth because they have a smaller asset base (and cash flow stream) off which to build.


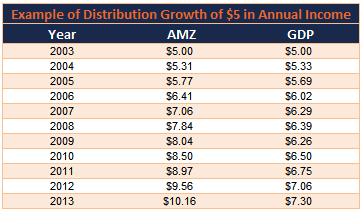
The following tables provide an example of how $5 in income would have grown over the past 10 years, based on whether it grew at the same pace as AMZ distributions, or at the pace of GDP.


Content continues below advertisement

2014.09.10 Greatest Hits - Dist Growth Percent


2014.09.10 Greatest Hits - Dist Growth Dollar


During the financial crisis, through conservative stewardship of capital, most MLPs were able to maintain or grow their distributions even when the US economy, as measured by GDP, shrunk considerably. Overall, a rising tide lifts all boats, and while MLPs are able to grow their distributions despite broader weakness in the economy, the greatest growth occurs when the country does well as a whole.

» Popular Pages

  • Tickers
  • Articles

Jun 18

S&P 500 Snapshot: Peace Deal Overcomes Fed Jitters

Jun 18

Treasury Yields Snapshot: June 18, 2026

Jun 18

Volatility Protection & Income in a Dynamic Buffered ETF

Jun 18

Covered Call ETFs Have Boomed – But Can They Be More?

Jun 18

Dimensional Consolidates $250B Lineup Into ETF Share Classes

Jun 18

NUKZ Holding Constellation Injects Millions Into Local Economies

Jun 18

What Drives Active ETF Growth? NEOS and Thornburg Weigh In

Jun 18

Capital Rotation: A Breakdown of This Week's Top ETF Flows

Jun 18

iShares Launches New Bitcoin Income ETF 

Jun 18

Kurv Launches SpaceX Enhanced Income ETF

QQQ

Invesco QQQ Trust Series I

VOO

Vanguard S&P 500 ETF

SMH

VanEck Semiconductor ETF

GLD

SPDR Gold Shares

SOXX

iShares Semiconductor ETF

DRAM

Roundhill Memory ETF

SCHD

Schwab US Dividend Equity ETF...

PPLT

abrdn Physical Platinum...

SOXL

Direxion Daily Semiconductor...

XLK

State Street Technology...

Loading Articles...

Advertisement

Is Your Portfolio Positioned With Enough Global Exposure?

ETF Education Channel

How to Allocate Commodities in Portfolios

Tom LydonApr 26, 2022
2022-04-26

A long-running debate in asset allocation circles is how much of a portfolio an investor should...

Core Strategies Channel

Why ETFs Experience Limit Up/Down Protections

Karrie GordonMay 13, 2022
2022-05-13

In a digital age where information moves in milliseconds and millions of participants can transact...

}
X