
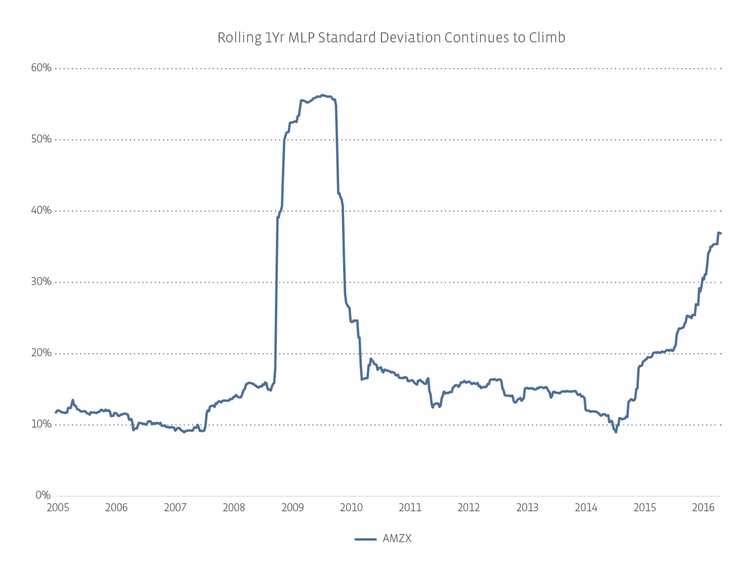
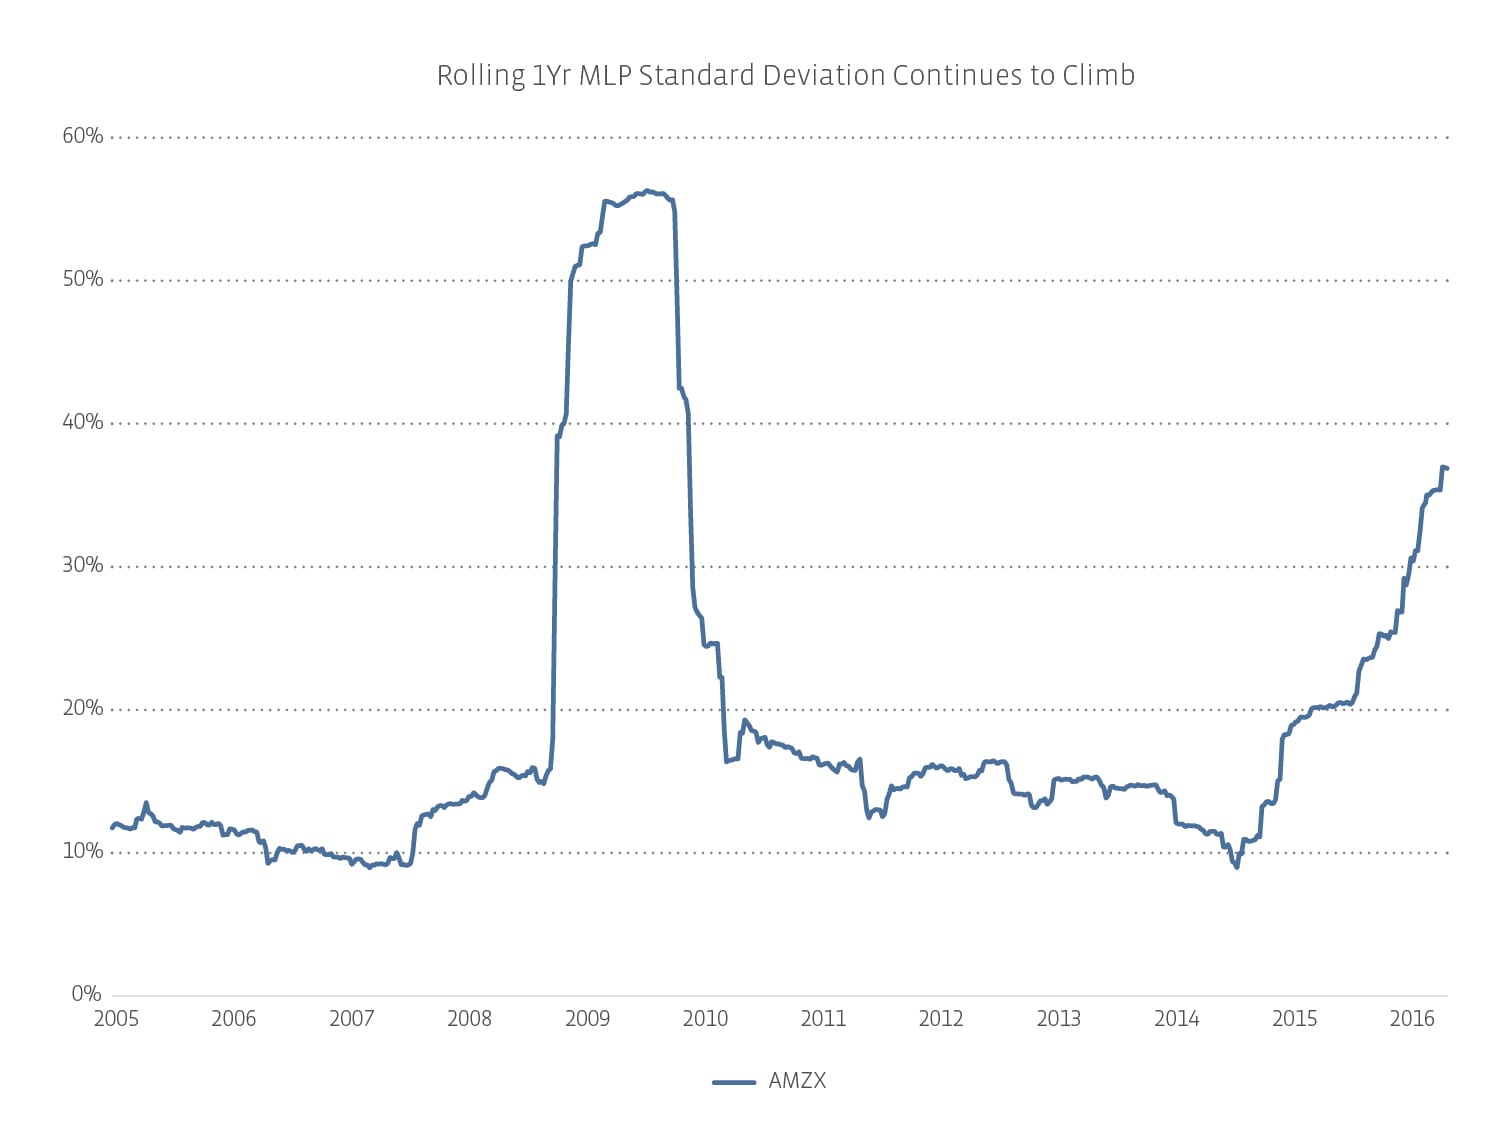
The other major indicator of market sentiment is volatility, which is most generally quantified by standard deviation. The more unsure investors are, the more wildly unit prices will fluctuate. During my Negative Nancy period, I ran some risk analysis and asked whether MLPs were ice cold. Standard deviation, on a rolling one-year basis, reached a local high at the end of 2015. However, this doesn’t necessarily mean the bottom has been achieved—standard deviation could go even higher, and it did. As of the beginning of May, rolling, one-year standard deviation for MLPs has reached a new all-time high. That said, standard deviation is a lagging indicator in this case—once it starts to roll, it may be an indication that a bottom has been reached.
Technicals
Capitulation (noun): the cessation of resistance; surrender. In the markets, this means investors have given up trying to recapture losses and are selling at any price. Charts show steep price declines on considerable volume (and may also incidentally include intense intraday reversals). The first quarter of 2016 saw 15 days when the AMZ lost more than 2.5% on a price return basis in a single day. During the entirety of 2015, there were only 21 such days. Roughly interpreted, that’s triple the declines that might have been expected, especially considering that 2015 was the second worst performance year ever for the AMZ.
Another sign of capitulation is that the market stops responding to bad news. An April 17, 2016 conference in Doha, Qatar of the world’s largest oil producing countries failed to produce a deal that would limit output. As a result, crude prices tumbled when trading reopened, but MLPs rose nearly 3% the following day. Similarly, wildfires in Alberta, Canada have caused the evacuation of the entire town of Fort McMurray, including oil sands workers, on May 3rd, necessarily curtailing production. MLPs have remained flat on the news. (Update: rainy weather has led officials to say residents may return perhaps within two weeks.)
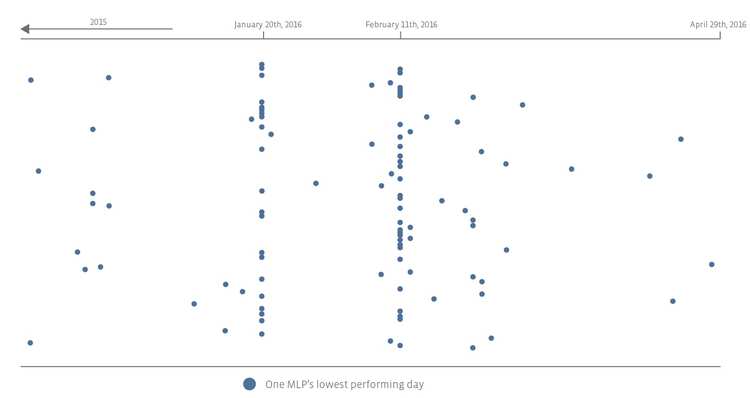
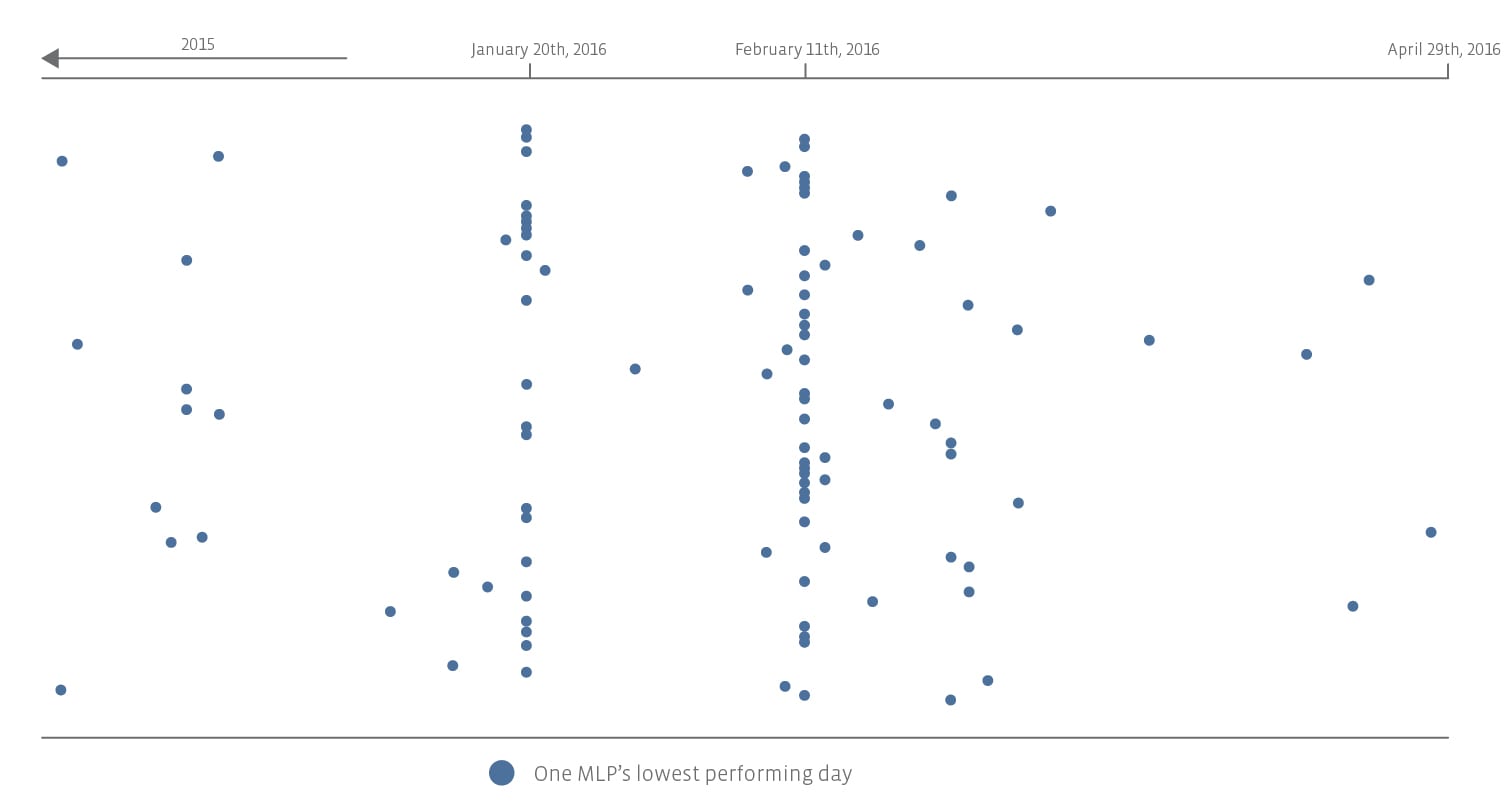
Two simpler technical indicators are whether the market is retesting previous bottoms, and whether more than 50% of the companies are making 52 week lows. As with all of the above, reaching a previous low (or the lowest price in a year) doesn’t mean you can’t fall further. During the financial crisis, the AMZ traded down to 154.1 (November 20, 2008), but the lowest it has been in the current period is 203.4 (February 11, 2016). That said, the index doesn’t have to reach previous lows to begin climbing back up. (The AMZ closed at 297.9 as of April 29th, a gain of nearly 50%.) Turning to 52-week lows, 17.8% of the 118 MLPs had their 52-week low on January 20, 2016, and 24.6% had their 52-week low on February 11, 2016. If we include the time between those two days, exactly 50% of the MLPs hit their 52-week lows during that time. As you can see in the chart below, many of the rest were clustered near that time as well.
Expert Investors
While there is no magic level of P/DCF or yield spread that indicates a bottom (since presumably the asset class is oversold well before the inflection point), at some point, the most skilled teams in the room will reach out and catch the falling knife. During the fourth quarter of 2015, Berkshire Hathaway added a position in the energy infrastructure corporation Kinder Morgan (KMI). Pension plans which have been watching the MLP space for years are finally committing to allocations. Some investors like to follow these large organizations into investments; others are more contrarian.
The Dead Cat Bounce
Despite all this evidence, it is certainly still possible that despite the 50% recovery off the lows, this is just a dead cat bounce, and there’s more downward movement to come. Said optimistically, the MLP space could still retest its lows, and there is a potential for a double-bottom. Even more optimistically, if you wanted to add to MLP positions and didn’t get a chance in February, you may get another.
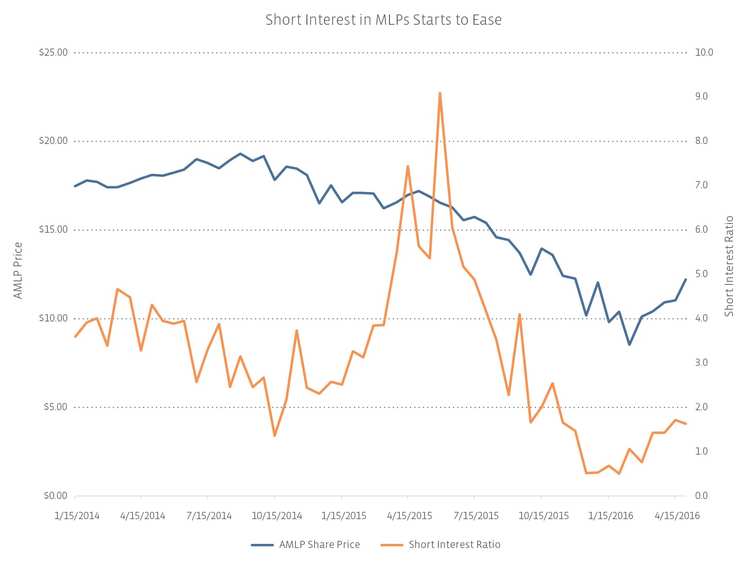
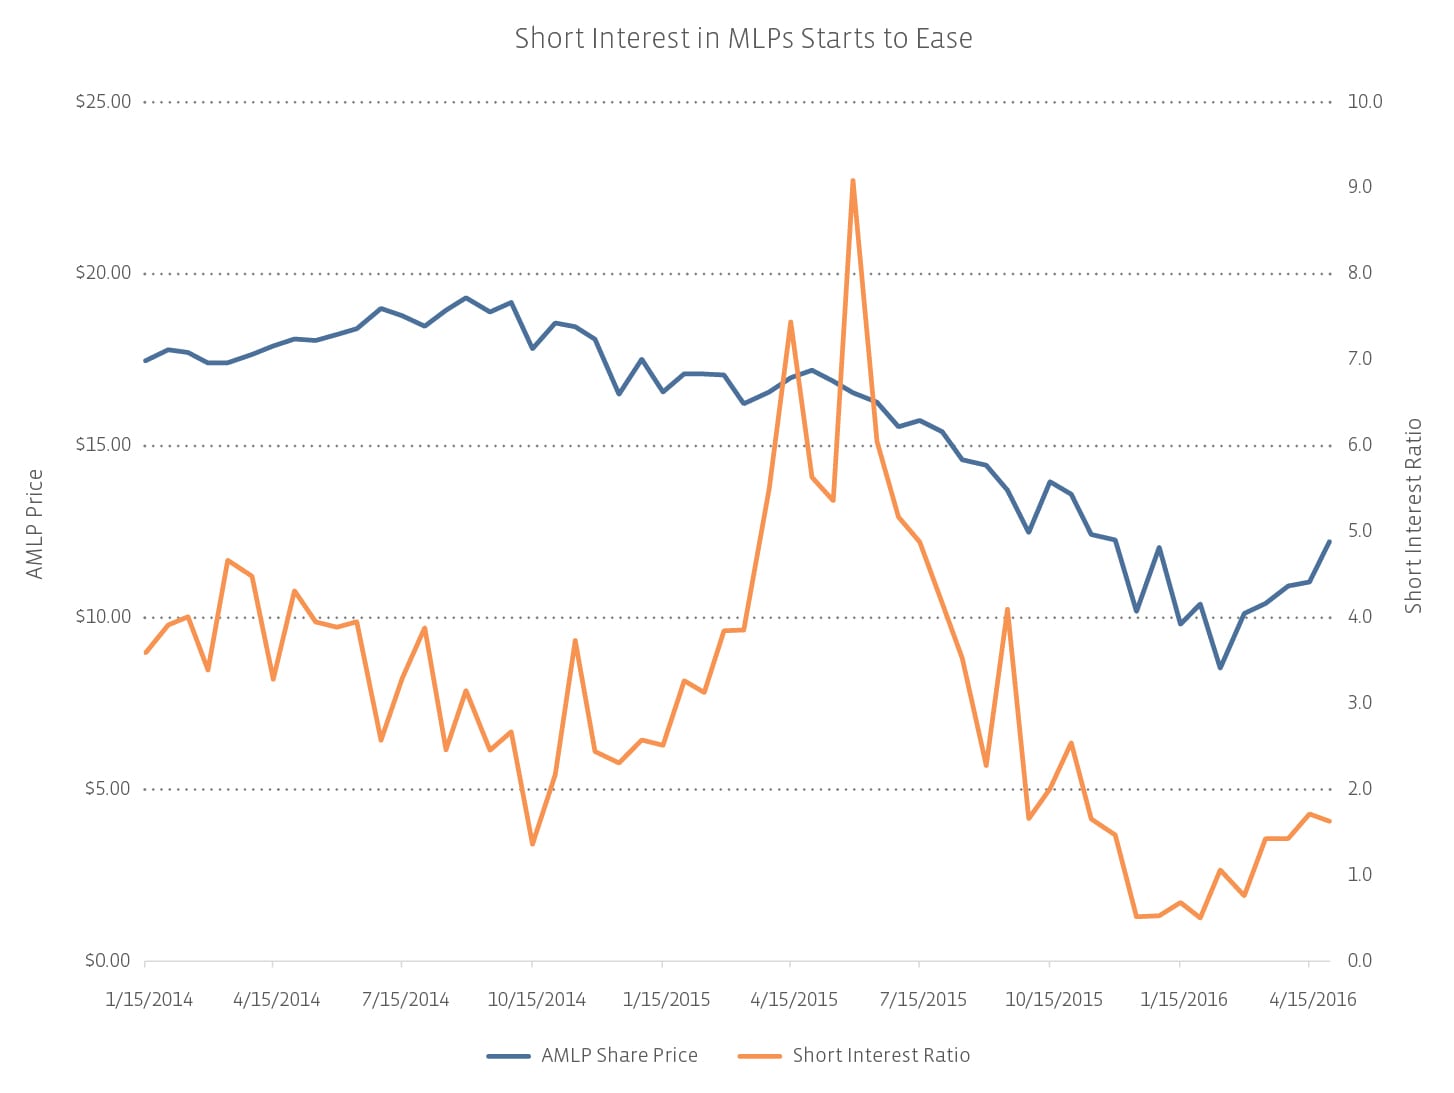
If your glass is half-full, you know the MLP market has already bottomed because short interest has eased, trading indicated capitulation, and smart but previously sidelined investors are making allocations.
If your glass is half-empty, then you think this is just a dead cat bounce, because standard deviation remains high and previous all-time index lows have not yet been tested.
Either way, drink up!

