
Free cash flow gaining traction.
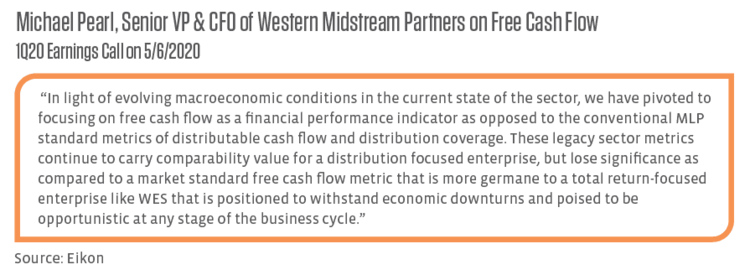
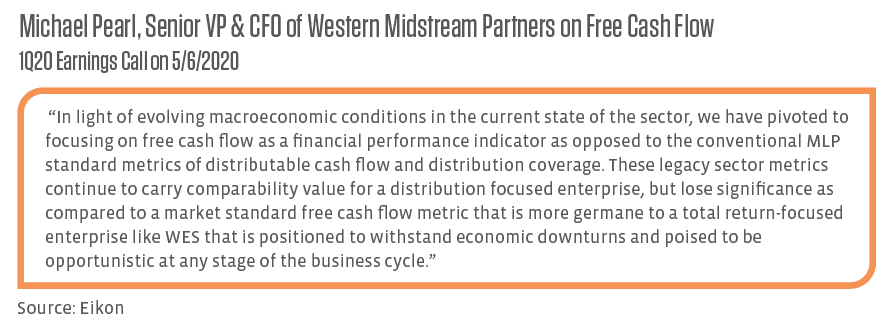
While helpful for comparing among MLPs, the use of distribution coverage has its shortcomings – namely the lack of comparability with other sectors. MLPs have begun to move away from distribution coverage and DCF in favor of metrics that are more widely used and better reflect their business models. On its 1Q20 earnings call in May, Western Midstream Partners (WES) noted that it will shift to focus on free cash flow given that it is more relevant for its total return-oriented business (see quote below). The company has joined Cheniere Energy Partners (CQP) as the only AMZI constituents that do not provide DCF. While it still reports DCF, DCP Midstream Partners (DCP) is emphasizing free cash flow. Going forward, the partnership will report free cash flow in place of distribution coverage, describing free cash flow as “a more comprehensive measure of cash flow and indicative of [its] ability to delever.” In 2Q20, DCP generated $54 million of free cash flow after distributions, benefiting from reductions to its capital program and its 50% 1Q20 distribution cut. With free cash flow becoming the priority across energy as the sector seeks to attract generalist investors, it is likely that MLPs will further incorporate free cash flow metrics into their reporting to complement or potentially replace traditional DCF-based metrics.
Payout ratios further emphasize midstream’s ability to afford dividends.
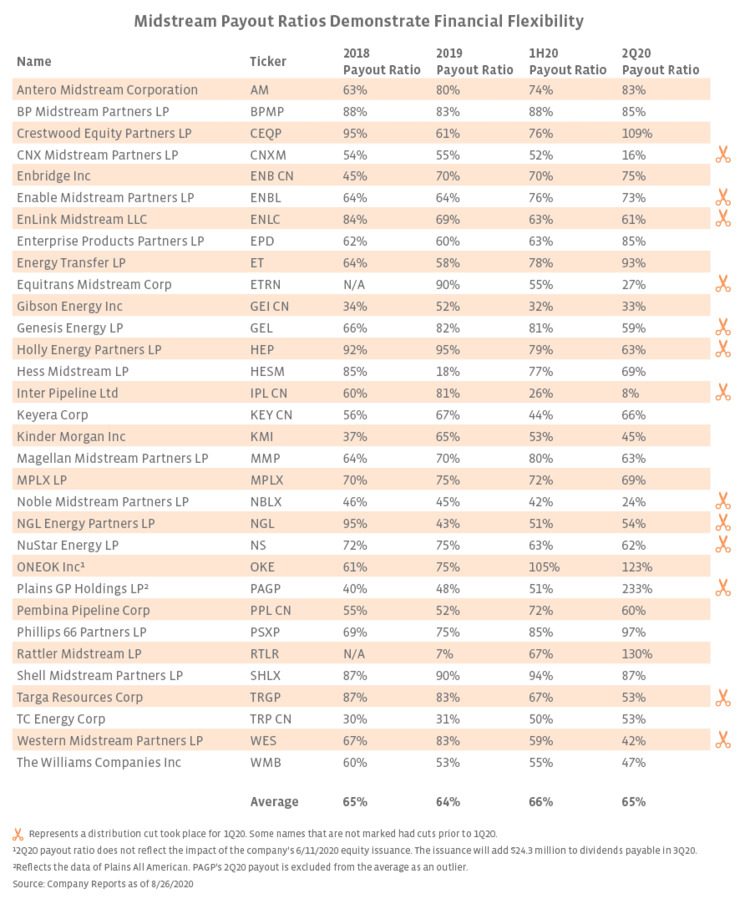
Looking at the broader energy infrastructure space, dividend payout ratios also highlight financial flexibility among midstream companies. The table below compares historical and current payout ratios for the dividend-paying constituents of the AMEI, with the ratio calculated using distributions paid in the period and operating cash flow for the denominator. For example, the 2Q payout ratio is comparing the distribution paid in 2Q from 1Q results and operating cash flow for 2Q. For names that cut their 1Q20 payouts (those paid in 2Q), the 1H20 payout ratio will reflect the larger 4Q19 dividends paid in 1Q20. Keep in mind that MLP payout ratios are generally higher than those of their C-Corps peers because MLPs are not burdened with income tax payments, and operating cash flow can be impacted by swings in working capital, which can be more common during periods of commodity price volatility.
As shown in the table, there is a wide dispersion among payout ratios reflecting a variety of idiosyncratic factors, including dividend policy, customer base, and the company’s operational footprint. Notably, the ratios for 2Q20 reflect the brunt of COVID-19 impacts on energy production and demand with multiple names seeing payout ratios above 100% for the quarter. In some ways, 2Q payout ratios can be considered a real-life stress test, providing an indication of a company’s ability to afford its dividend in what was likely one of the most challenging quarters in these companies’ histories. Despite 2Q headwinds, the average payout ratio for the dividend-paying constituents of the AMEI in 1H20 and 2Q20 is in line with that of the full years 2018 and 2019. For 2Q20, eight out of 32 names had a payout ratio below 50%. Names that cut dividends earlier in the year generally saw a reduction in their payout ratios and represent the lower end of the data set, with the notable exception of Plains All American (PAA), which had a notable shift in working capital from 1Q to 2Q. After cutting its April dividend by 72%, Inter Pipeline (IPL) had the lowest 2Q20 payout ratio of all AMEI constituents at 8%.
Bottom line: What does this mean for investors?
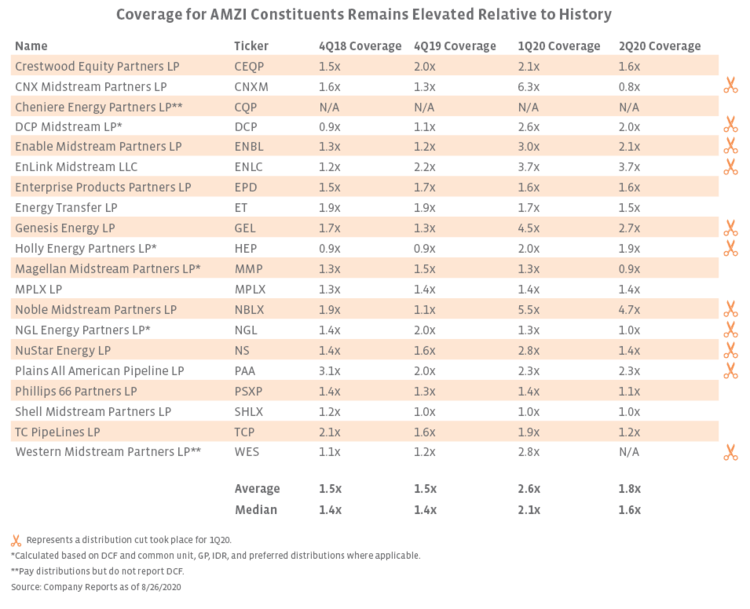
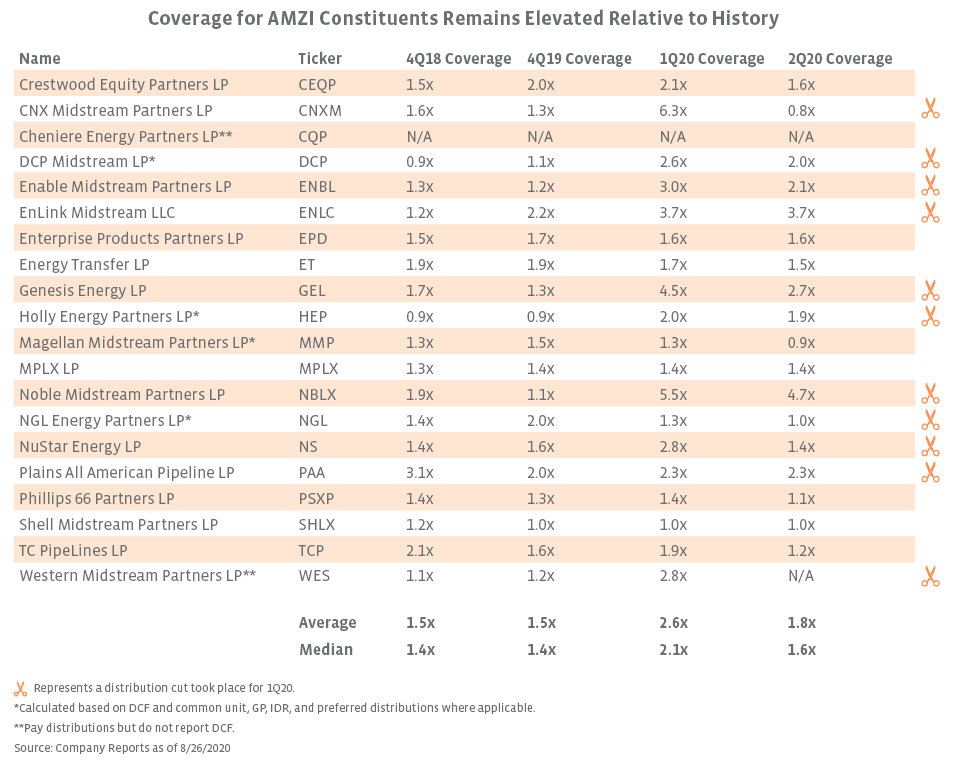
For investors frustrated by abnormally high midstream yields or wary of additional cuts to payouts, distribution coverage and payout ratio data is helpful for gauging how well companies can afford their dividends. All things considered, the coverage and payout data are encouraging for investors looking to midstream and MLPs as a source of income in their portfolios. Some companies fared better than others in the real-life stress test that was 2Q20, reinforcing the resilience and strength of these businesses in an extremely tough environment. Importantly, however, all these companies maintained or grew their payouts sequentially for 2Q20 as management teams looked past the temporary headwinds in the quarter to an ongoing recovery. In short, companies stayed the course despite stretched payout ratios for 2Q in some cases. With free cash flow in focus across energy, commentary around free cash flow generation after dividends and reporting those values each quarter would provide greater clarity on a company’s financial flexibility while allowing for comparability with other sectors. While MLP-centric measures using DCF are likely to stay, they should be complemented with more widely used metrics.

