
Source: Moody’s
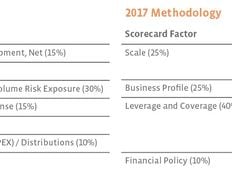
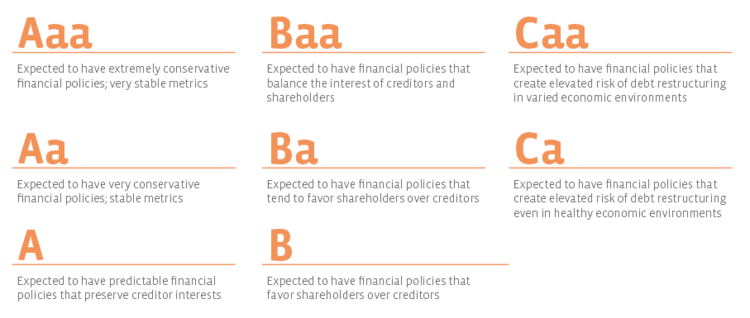
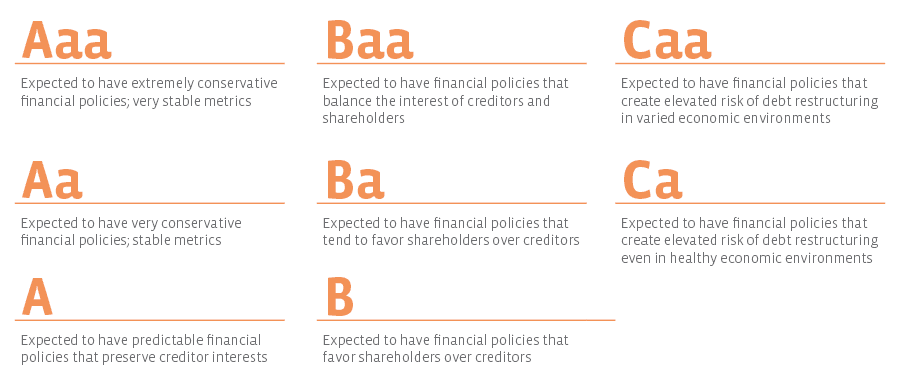
Moody’s credit rating categories range from Aaa (best) to Ca (worst). Each rating has a score range, which is determined by using a scorecard of four factors: Scale, Business Profile, Leverage and Coverage, and Financial Policy. Some of the four factors have sub-factors.
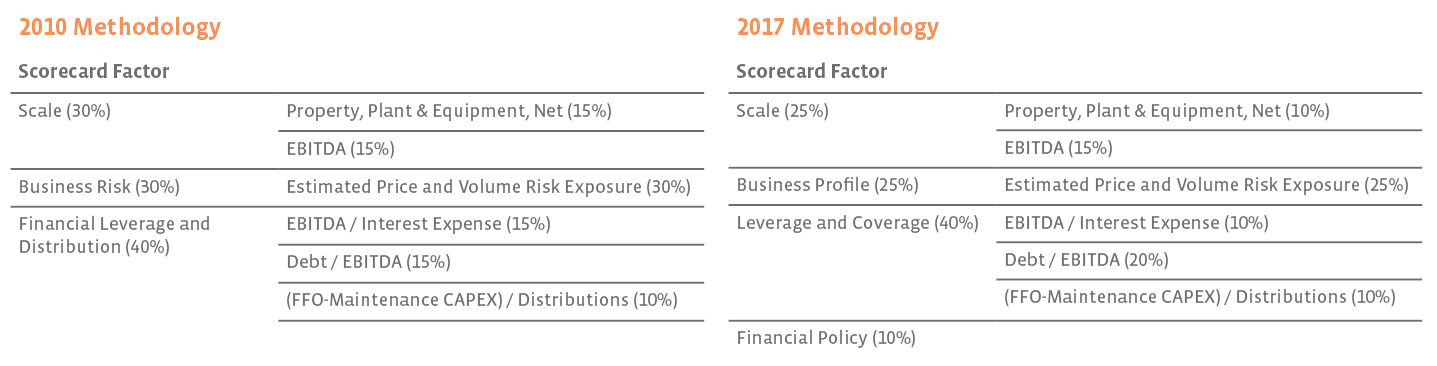
As seen in the chart above, this new methodology added Financial Policy as one of the scorecard factors, accounting for 10% of a company’s score. Financial Policy can best be described as a measure of management’s risk appetite. To determine this, the ratings agency will look at a company’s targeted credit profile, history of prior actions, track record of risk and liquidity management (particularly during different phases of economic and industry cycles), and adherence to commitments. In addition, Moody’s considers management’s history of M&A activity, how acquisitions were typically funded, and types of acquisitions (i.e. were the assets part of the company’s core competency or new business lines where the company could lack the in-house expertise to run the assets).
After evaluating such factors, Moody’s then determines the Financial Policy score based on the scale below.
Source: Moody’s
Whereas the score for the other three scorecard factors is based on sub-factor metrics that are more numerical in nature (i.e. total EBITDA dollar value, Debt/EBITDA, etc.), the score for Financial Policy is determined in a more subjective way. The difference between “extremely conservative” and “very conservative” may vary between credit analysts.
While subjective, the addition of Financial Policy to the scorecard makes sense. A company could easily find creative ways to “check the box” on the numerical metrics of the other three scorecard factors, but if the ratings agencies do not think management’s approach to achieving such metrics was conservative enough, then a company could be penalized. Albeit an extreme example, Moody’s favors the student who studied two hours a night for two weeks prior to an exam over the student who crammed the last minute over the student who happened to be a good multiple-choice guesser—even if all three students received the same grade.
As a result of the new factor accounting for 10% of the score, 5% was deducted each from the Scale and Business Profile factors, as shown above.
More in-depth explanations of the other three scorecard factors (Scale, Business Profile, and Leverage/Coverage) are featured in our “Research Spotlight: MLPs Making the Grade, Part 1” piece.
In short: While credit agencies may favor companies that have extremely conservative financial policies, an equity investor may be comfortable with management that takes more risks (for the hope of more return) and prefer a company that does favor shareholders over creditors (ex: Ba or B on the Financial Policy scale).
Simpler Partnership Structures Viewed Positively for Financial Policy
In recent years, the increased cost-of-capital conundrum for MLPs in the higher incentive distribution right (IDR) split levels has resulted in multiple consolidation or simplification transactions: GPs being bought in, IDRs being eliminated, GPs buying their MLP, etc.
In the 2010 methodology edition, Moody’s tended to view GPs and their control over the MLP as more of a corporate governance issue, with the concern that the GP could make decisions for the MLP to the detriment of common unitholders and bondholders. That said, if an MLP had a GP that owned a substantial amount of common units, Moody’s perceived this to have less risk, as interests were likely more aligned. The 2010 edition notes that MLPs buying in their GP and eliminating IDRs is viewed positively from a corporate governance and bondholder standpoint. However, this stance was a one-off “Other Consideration” and did not specifically fall under a scorecard factor.
Such simplification factors now fall under the new Financial Policy scorecard for the 2017 edition. Specifically, the guide notes “simpler partnership structures — where the MLP buys in the general partner and eliminates incentive distribution rights— would typically score higher.”
In short: The recent string of simplification and consolidation transactions have largely been triggered by the need to reduce a company’s cost of equity. A simplified partnership structure is something both equity and debt investors see positively.
Risk Profile for Crude Oil Pipelines and Intrastate Gas Pipelines Viewed Similarly
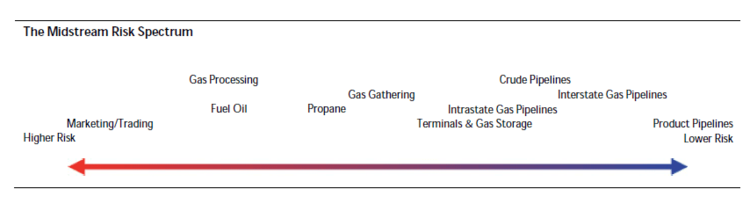
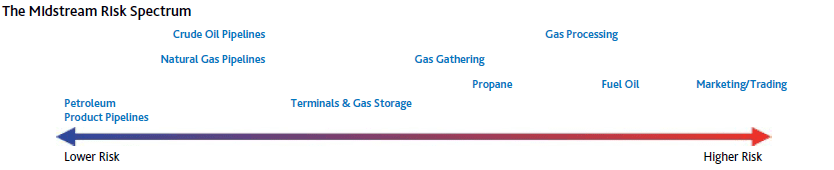
Business Profile risk (25% of the scorecard) looks at where a company is in the energy value chain, as well as their price and volume risk exposure. Moody’s analysts use the below spectrum to assess Business Profile risk.
This diagram represents the 2017 edition:

Source: Moody’s
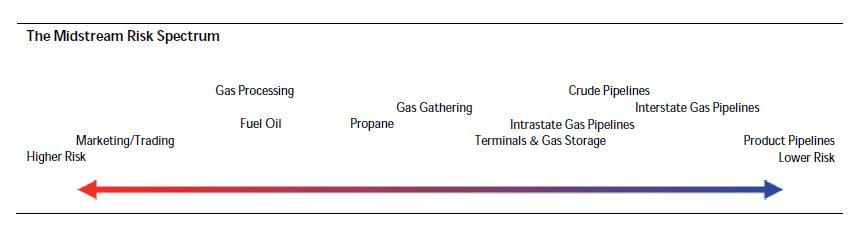
This diagram represents the 2010 edition: (Yes, you’ll need to train your brain to think reverse if you’re comparing the two.)
Source: Moody’s
The most significant changes from the 2010 to 2017 edition are that interstate gas pipelines were removed (see section below), crude oil pipelines shifted to become lower risk, and intrastate gas pipelines also shifted to become lower risk. In fact, Moody’s now views crude oil pipelines and intrastate gas pipelines at the same level of price/volume risk.
While Moody’s does not provide specific explanations for what has driven these changes in risk level since 7 years ago, they do present both sides of the story for each asset. The pace of growth in crude oil production is more muted versus natural gas (fewer swings in estimates), however crude oil pipelines bear greater volumetric risk—likely due to commodity prices. Intrastate natural gas pipelines have two bases of customers—“demand pull” (utilities) and supply push” (producers), but reserves are subject to a steeper decline curve.
In short: While Moody’s now places crude oil pipelines and intrastate gas pipelines at the same level of price/volume risk on the general midstream energy risk spectrum, this is not a green light for equity investors to assume every MLP that operates such assets carry the same level of risk. Investors must still dig deeper into other areas such as credit quality of customers, area of operation, and contract length.
Tariff-Regulated Long Haul Natural Gas Pipelines No Longer Under the Midstream Energy Methodology Framework
In November 2012, Moody’s released a methodology for Natural Gas Pipelines, which applies to companies that generate at least two-thirds of their cash flow from natural gas long-haul transportation and ancillary activities that are tariff-regulated, or where contracts are set within a federally tariff-regulated framework.
One of the reasons for the separate methodology is that long-haul gas pipeline assets tend to be placed in a single-asset operating company; meaning, the only asset in the company is one pipeline. For example, the El Paso Natural Gas Company owns the El Paso Natural Gas pipeline system. Even though Kinder Morgan (KMI) owns the El Paso Natural Gas Company, financing actually happens at the pipeline, and not KMI level. Thus, it makes sense to evaluate each “pipeline company” separately. The four factors that impact ratings are Market Position, Quality of Supply Sources, Contract Quality, and Financial Strength.
Moody’s notes these assets are low risk, being federally regulated and drawing most of their revenues from volume-insensitive demand charges under long-term contracts. Tariffs for non-federally regulated pipelines, on the other hand, tend to be negotiated with shippers on shorter term contracts.
In short: Not all natural gas pipelines are the same. As an investor, it’s important to understand whether a company owns a gathering gas pipeline, an intrastate gas pipeline, or interstate gas pipeline—all have different risk profiles.
Moody’s does not anticipate that the updated methodology will result in any ratings changes. Rather, the updated methodology provides a more transparent presentation of the principles that they have already been using to assign ratings.

