ETFdb Logo
  • ETF Database
  • Content Hubs
    • Themes
      • Active ETF
      • Alternatives
      • Artificial Intelligence
      • China Insights
      • Core Strategies
      • Crypto
      • Disruptive Technology
      • Energy Infrastructure
      • ETF Building Blocks
      • ETF Investing
      • ETF Strategist
      • Financial Literacy
      • Fixed Income
      • Free Cash Flow
      • Future ETFs
      • Innovative ETFs
      • Institutional Income Strategies
      • Leveraged & Inverse
      • Market Insights
      • Market Outlooks
      • Modern Alpha
      • Nuclear Energy
      • Portfolio Strategies
      • Sector Investing
      • Tax Efficient Income
      • Thematic Investing
    • Asset Class
      • Equity
        • U.S. Equity
        • Int'l Developed
        • Emerging Market Equities
      • Alternatives
        • Gold/Silver/Critical Materials
        • Cryptocurrency
        • Currency
        • Volatility
      • Fixed Income
        • Investment Grade Corporates
        • US Treasuries & TIPS
        • High Yield Corporates
        • Int'l Fixed Income
    • ETF Ecosystem
    • ETFs in Canada
    • Market Outlook
    • Crypto ETF Hub
  • Tools
    • ETF Screener
    • ETF Country Exposure Tool
    • ETF Database Categories
    • Indexes
    • Scenario Analysis
    • Watchlists
    • Head-To-Head ETF Comparison Tool
    • Mutual Fund To ETF Converter
    • ETF Stock Exposure Tool
    • ETF Issuer Fund Flows
  • Research
    • ETF Education
    • Equity Investing
    • Dividend ETFs
    • Leveraged ETFs
    • Inverse ETFs
    • Index Education
    • Index Insights
    • Top ETF Sectors
    • Top ETF Issuers
    • Top ETF Industries
  • Webcasts
  • Sectors
    • Sector Investing Content Hub
    • XLK
    • XLI
    • XLU
    • XLY
    • XLP
    • XLRE
    • Sector Power Rankings
    • XLE
    • XLC
    • XLF
    • XLV
    • XLB
  • Multimedia
    • ETF 360 Video Series
    • ETF of the Week Podcast
    • Gaining Perspective Podcast
    • ETF Prime Podcast
    • Video
  • Company
    • About VettaFi
  • PRO
    • Pro Content
    • Pro Tools
    • Advanced
    • FAQ
    • Free sign up
    • Login
  1. Index Insights
  2. How Much Energy Infrastructure Does North America Still Need?
Index Insights
Share

How Much Energy Infrastructure Does North America Still Need?

Stacey Morris, CFAJun 25, 2018
2018-06-25

When we aren’t being asked about topics like distribution growth, self-funding, restructurings, and the FERC policy revisions, investors often ask about the runway of growth for energy infrastructure. The impressive build out of pipelines, not to mention pipeline reversals and conversions, completed in the wake of the shale boom left some investors wondering how much more midstream infrastructure is really needed. While we can qualitatively discuss the need for additional infrastructure, it’s helpful to have quantitative data around the required investment in infrastructure. Last week, the Interstate Natural Gas Association of America (INGAA) released its latest study prepared by ICF on estimated energy infrastructure investment required in the US and Canada through 2035. In today’s post, we’ll delve into the near-term and long-term takeaways from the report and look at how the 2018 study compares to the 2016 report.

$521 billion in midstream infrastructure investment needed through 2035.

The 2018 study includes two scenarios – one with constant unit costs and one with escalating unit costs. The study estimates a total of $791 billion will be needed for investment in oil and gas infrastructure from 2018 to 2035, representing an average of the two scenarios. The headline number includes investment in surface and lease equipment – the equipment necessary for onshore wells and production platforms in the Gulf of Mexico. We strip out surface and lease equipment to get to $521 billion ($29 billion per year) of midstream investments as shown below. For reference, the total North American energy infrastructure market cap was $710 billion as of May 31, 2018.

This is the image alt text

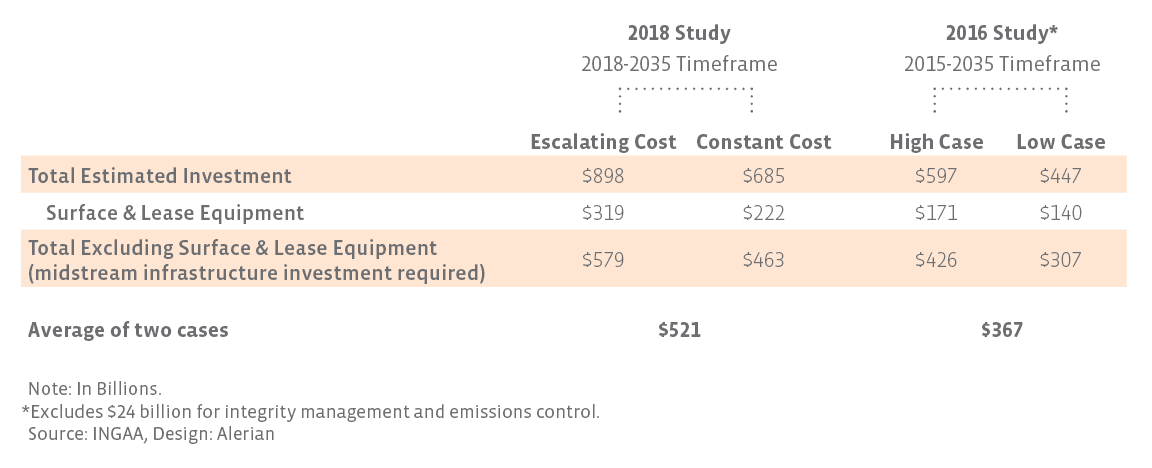
How does the 2018 study compare to the 2016 study? For context, the prior study was released in April 2016, shortly after WTI oil prices had hit a relative bottom at ~$26/Bbl in February. In other words, energy land was looking fairly glum at that time. With the improvement in WTI oil prices to the mid-$60’s/Bbl recently, the estimated investment in oil and gas infrastructure has not surprisingly increased with the 2018 report. The average case for 2018-2035 of $521 billion is greater than even the high case from the 2016 study. Keep in mind the 2016 report covers three additional years. To even the playing field, the updated run rate of $29 billion per year in spending is well above the 2016 high case run rate of $20 billion per year.

Where are all those billions going?

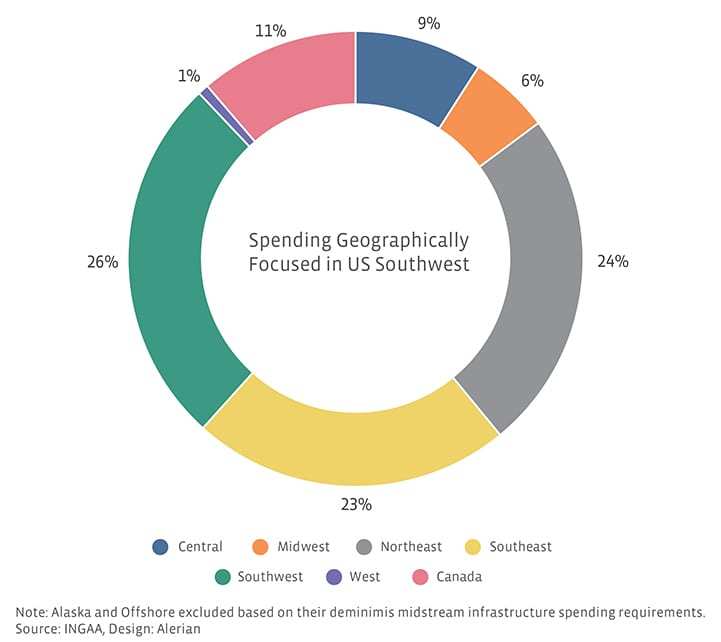
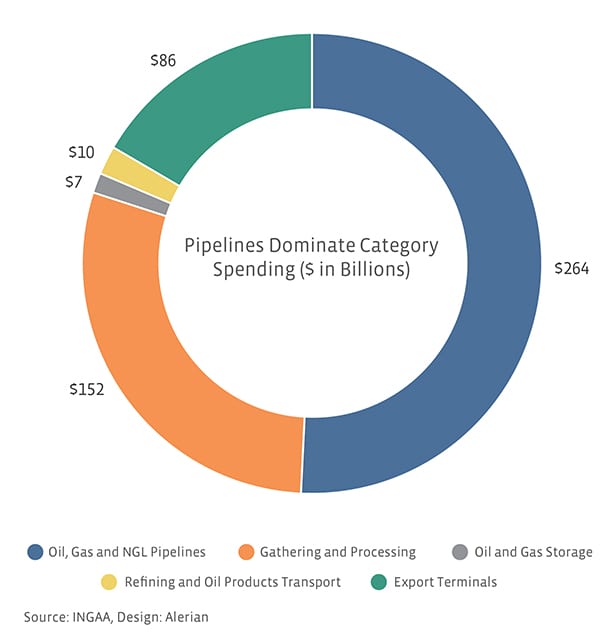
Of the $521 billion expected to be invested in US and Canadian midstream infrastructure through 2035, approximately half is allocated to oil, gas and NGL pipelines at a rate of ~$14.7 billion per year. Almost a third will be related to gathering and processing investments, equating to over $8 billion per year. Export terminals are expected to account for the third largest spending category, representing 17% of the total. Geographically, of the $521 billion, approximately a quarter of the total spending is expected to be concentrated in the Southwest US (TX, OK, LA, AR, NM). Canada represents 11% or $59 billion of the total estimated midstream spend.


Content continues below advertisement

This is the image alt text

This is the image alt text

What is the spending trend relative to recent years?

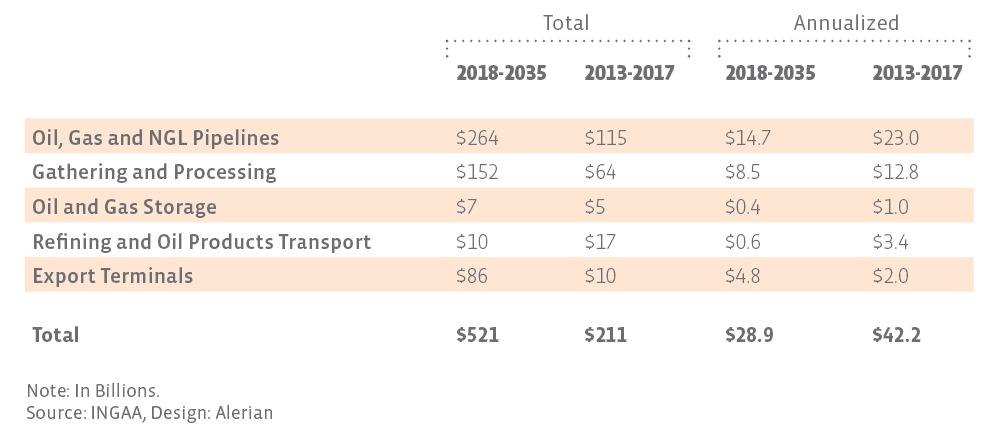
Infrastructure spending has been robust in recent years, as US oil production increased by 2.9 million barrels per day (44.0%) and natural gas production increased by 10 billion cubic feet per day (12.3%) from 2012 to 2017. For the five-year period of 2013-2017, spending (excluding surface and lease equipment) averaged $42 billion per year. Though more moderate, the $29 billion annualized spend for 2018-2035 is still robust. As shown in the table below, export terminals are the only category expected to see a pick-up in annualized spending relative to the prior five years. We’ve discussed in past posts how rising exports will create growth opportunities for MLPs and energy infrastructure companies.

This is the image alt text

Spending forecasted to peak in 2019, but we’ve seen false peaks before.

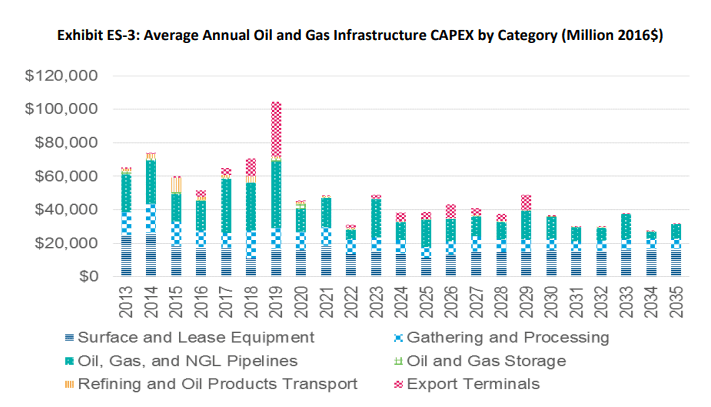
The 2018 study forecasts that infrastructure investment in the US and Canada will peak next year at over $100 billion (including surface and lease equipment) – topping the $74 billion spend from 2014 as shown in the graphic below. Relative to other years, outsized spending on export terminals and pipelines drives the heightened spending in 2019. Examples of additional LNG capacity expected to be completed in 2019 include trains 1 and 2 from Cheniere’s (LNG) Corpus Christi terminal and train 5 from its Sabine Pass terminal, train 1 from Sempra’s (SRE) joint venture Cameron LNG terminal, and units at Kinder Morgan’s (KMI) Elba Island terminal. There should be good visibility for 2019 spending at this point in 2018, meaning the $100+ billion estimate should include less guesswork than outyear forecasts. Only time will tell if 2019 will really represent the peak for infrastructure spending. For reference, the 2016 study expected spending to peak in 2016 under the high case and to have already peaked in 2014 under the low case.

This is the image alt text

Source: INGAA

Bottom Line

With most oil and gas forecasts, any projection beyond five years should probably be taken with some degree of caution. Predicting the future is difficult as things constantly change — just look at the differences in projections from the 2016 study to the 2018 study. That said, the updated INGAA study is still informative for midstream investors, providing useful information on what categories will see investment and what geographic regions will see investment. The expectation for robust infrastructure investment in 2018-19, relative to the already high spend in the last five years, is particularly noteworthy, as is the expected investment in exports. While the study provides comfort around long-term growth prospects, the expected investments in the near-term may be more exciting to today’s investors.

Alerian is on Twitter! Join the conversation with @AlerianIndices.

» Popular Pages

  • Tickers
  • Articles

Jun 22

World Markets Watchlist: June 22, 2026

Jun 22

Emerging Markets to Spike as Oil Prices Dip? Try GSEE

Jun 22

Look Beyond Market Euphoria After 3 FCF ETFs Rebalanced

Jun 22

Private Credit Offers Viable Yield Path as Rates Stay Elevated

Jun 22

Franklin Files for Bitcoin-Integrated Dividend ETFs

Jun 22

Managing Exposure to International Equity ETFs Amid UK Political Shifts

Jun 22

Physical AI & Global Reshoring Beyond the Humanoid Hype

Jun 22

VIDEO: ETF of the Week: VFLO

Jun 22

Gaming ETF GAMR Adds Arcade Gaming Giant to Portfolio

Jun 22

Weekly Economic Snapshot: A Hawkish Hold in a High-Stakes Market

QQQ

Invesco QQQ Trust Series I

VOO

Vanguard S&P 500 ETF

GLD

SPDR Gold Shares

PPLT

abrdn Physical Platinum...

SIVR

abrdn Physical Silver Shares...

FOTO

Tuttle Capital Pure Play...

SMH

VanEck Semiconductor ETF

DRAM

Roundhill Memory ETF

SCHD

Schwab US Dividend Equity ETF...

IVV

iShares Core S&P 500 ETF

Loading Articles...

Advertisement

Is Your Portfolio Positioned With Enough Global Exposure?

ETF Education Channel

How to Allocate Commodities in Portfolios

Tom LydonApr 26, 2022
2022-04-26

A long-running debate in asset allocation circles is how much of a portfolio an investor should...

Core Strategies Channel

Why ETFs Experience Limit Up/Down Protections

Karrie GordonMay 13, 2022
2022-05-13

In a digital age where information moves in milliseconds and millions of participants can transact...

}
X