ETFdb Logo
ETFdb Logo
  • ETF Database
  • Channels
    • Themes
      • Active ETF
      • Artificial Intelligence
      • Beyond Basic Beta
      • China Insights
      • Climate Insights
      • Core Strategies
      • Crypto
      • Direct Indexing
      • Disruptive Technology
      • Energy Infrastructure
      • ETF Building Blocks
      • ETF Investing
      • ETF Education
      • ETF Strategist
      • Financial Literacy
      • Fixed Income
      • Free Cash Flow
      • Innovative ETFs
      • Institutional Income Strategies
      • Leveraged & Inverse
      • Managed Futures
      • Market Insights
      • Modern Alpha
      • Multifactor
      • Responsible Investing
      • Retirement Income
      • Tax Efficient Income
    • Asset Class
      • Equity
        • U.S. Equity
        • Int'l Developed
        • Emerging Market Equities
      • Alternatives
        • Commodities
        • Gold/Silver/Critical Minerals
        • Currency
        • Volatility
      • Fixed Income
        • Investment Grade Corporates
        • US Treasuries & TIPS
        • High Yield Corporates
        • Int'l Fixed Income
    • ETF Ecosystem
    • ETFs in Canada
  • Tools
    • ETF Screener
    • ETF Country Exposure Tool
    • ETF Sector Tracker Tool
    • ETF Database Categories
    • Head-To-Head ETF Comparison Tool
    • ETF Stock Exposure Tool
    • ETF Issuer Fund Flows
    • Indexes
    • Mutual Fund To ETF Converter
  • Research
    • ETF Education
    • Equity Investing
    • Dividend ETFs
    • Leveraged ETFs
    • Inverse ETFs
    • Index Education
    • Index Insights
    • Top ETF Sectors
    • Top ETF Issuers
    • Top ETF Industries
  • Webcasts
  • Themes
    • AI ETFs
    • Blockchain ETFs
    • See all Thematic Investing ETF themes
    • ESG Investing
    • Marijuana ETFs
  • Multimedia
    • ETF 360 Video Series
    • ETF of the Week Podcast
    • ETF Prime Podcast
    • Video
  • Company
    • About VettaFi
    • Get VettaFi’ed
  • PRO
    • Pro Content
    • Pro Tools
    • Advanced
    • FAQ
    • Pricing
    • Free Sign Up
    • Login
  1. Index Insights
  2. Insights at a Glance: Examining Improved MLP Financial Footing Since 2014
Index Insights
Share

Insights at a Glance: Examining Improved MLP Financial Footing Since 2014

Special to VettaFiApr 02, 2020
2020-04-02

Given the staggering 58.5% year-to-date drop in oil prices to $25.32 per barrel (bbl) as of yesterday, investors have begun to compare the current energy environment to the downturn from 2014-2016. For context, additional supply from OPEC drove WTI crude prices down 75.6% from $107.26/bbl on June 20, 2014, to a bottom of $26.21/bbl on February 11, 2016. Consequently, annual US oil production declined in 2016 for the first time in eight years. The Alerian MLP Infrastructure Index (AMZI) dropped 59.7% from the oil price peak to its trough, and several MLPs cut their distributions. However, this was a much different time for the industry. Midstream MLPs were growing rapidly in order to meet the demand for additional energy infrastructure caused by the shale boom and were reliant on equity capital markets to fund that build-out. In many cases, these companies also had a large amount of debt on the books, were burdened with incentive distribution rights (IDRs), and had a thin cushion between cash flows generated and distributions paid. When equity capital markets began to close on MLPs, distribution cuts were necessary to direct capital to either growth projects or debt payments. Once oil prices began to recover in 2016 and in the following years, the MLP sector began to further emphasize balance sheet strength, distribution coverage, the elimination of IDRs, and self-funding the equity portion of capital expenditures. Additionally, after years of maximizing spending to keep up with US oil and natural gas production growth, the majority of midstream companies likely reached peak growth capex within the last two years (read more). Several MLPs have gone on to further cut back on discretionary spending given the shift in the macro environment (read more). The combination of these efforts represents a significant transformation of the space and has strengthened the MLP business model.

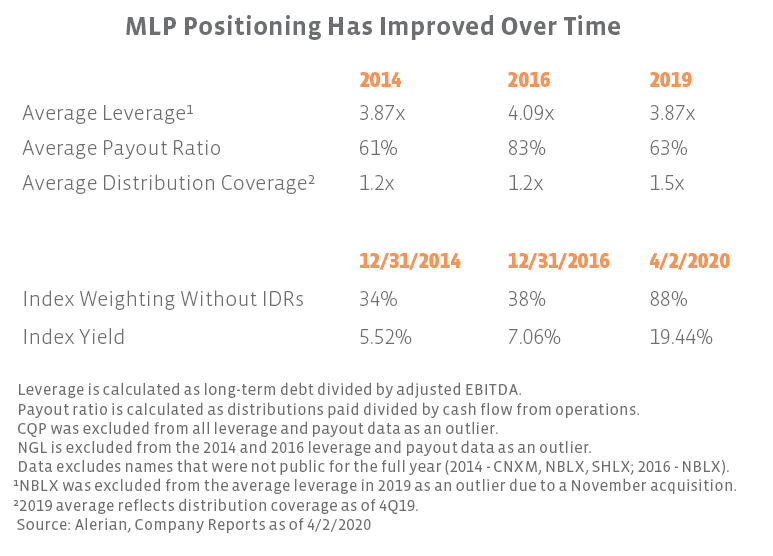
The table below compares the average leverage, distribution coverage, and payout ratios for current constituents of the Alerian MLP Infrastructure Index (AMZI) for 2014, 2016, and 2019. The table also shows the percentage of constituents by weighting that have eliminated IDRs. Leverage and payout ratios are flat when compared to 2014, but AMZI constituents have improved in each category analyzed since the end of 2016. While the elimination of IDRs is the most dramatic change, the rise in average distribution coverage is more evident of the shift in MLPs’ business models, as companies retain cash flows to fund growth spending and reduce leverage. Despite the positive progress that has been made, the current AMZI yield, which incorporates recent distribution cut announcements, is significantly higher than at year-end 2014 or 2016, implying that more risk is being priced into MLP equities in the current oil and gas price environment. While yields are elevated, these changes leave AMZI constituents better positioned to withstand market volatility.

This is the image alt text


Content continues below advertisement

» Popular Pages

  • Tickers
  • Articles

Sep 29

A Fixed Income Primer for Constructing Portfolios

Sep 29

Main Management Market Note: September 29, 2023

Sep 29

Higher for Much Longer?

Sep 29

Moving Averages: S&P Ends September Down 4.9%

Sep 29

This Week in ETFs: FormulaFolios Renamed & Adds New Funds

Sep 29

Play Online Car Sales News in These 2 China ETFs

Sep 29

SEC Opens Ethereum Futures ETF Floodgates

Sep 29

VettaFi Voices On: Managing Risk in an Uncertain Economy

Sep 29

SPYI Outperforms SPY in Challenging 3rd Quarter

Sep 29

More Rate Hikes? Watch Treasury ETF USFR

QQQ

Invesco QQQ Trust Series I

SPY

SPDR S&P 500 ETF Trust

VOO

Vanguard S&P 500 ETF

JEPI

JPMorgan Equity Premium...

TLT

iShares 20+ Year Treasury...

SCHD

Schwab US Dividend Equity ETF...

SMH

VanEck Semiconductor ETF

VGT

Vanguard Information...

VTI

Vanguard Total Stock Market...

XLK

Technology Select Sector SPDR...

Loading Articles...
Our Sites
  • VettaFi
  • Advisor Perspectives
  • ETF Trends
Tools
  • ETF Screener
  • Mutual Fund to ETF Converter
  • Head-To-Head ETF Comparison
  • ETF Country Exposure Tool
  • ETF Stock Exposure Tool
  • ETF Database Pro
More Tools
  • Financial Advisor & RIA Center
Explore ETFs
  • ETF News
  • ETF Category Reports
  • Premium Articles
  • Alphabetical Listing of ETFs
  • Browse ETFs by ETF Database Category
  • Browse ETFs by Index
  • Browse ETFs by Issuer
  • Compare ETFs
Information
  • Contact Us
  • Terms of Use and Privacy Policy
  • © 2023 VettaFi LLC. All rights reserved.

Advertisement

Is Your Portfolio Positioned With Enough Global Exposure?

ETF Education Channel

How to Allocate Commodities in Portfolios

Tom LydonApr 26, 2022
2022-04-26

A long-running debate in asset allocation circles is how much of a portfolio an investor should...

Core Strategies Channel

Why ETFs Experience Limit Up/Down Protections

Karrie GordonMay 13, 2022
2022-05-13

In a digital age where information moves in milliseconds and millions of participants can transact...

}
X