ETFdb Logo
ETFdb Logo
  • ETF Database
  • Channels
    • Themes
      • Active ETF
      • Artificial Intelligence
      • Beyond Basic Beta
      • China Insights
      • Climate Insights
      • Core Strategies
      • Crypto
      • Direct Indexing
      • Disruptive Technology
      • Energy Infrastructure
      • ETF Building Blocks
      • ETF Investing
      • ETF Education
      • ETF Strategist
      • Financial Literacy
      • Fixed Income
      • Free Cash Flow
      • Innovative ETFs
      • Institutional Income Strategies
      • Leveraged & Inverse
      • Managed Futures
      • Market Insights
      • Modern Alpha
      • Multifactor
      • Responsible Investing
      • Retirement Income
      • Tax Efficient Income
    • Asset Class
      • Equity
        • U.S. Equity
        • Int'l Developed
        • Emerging Market Equities
      • Alternatives
        • Commodities
        • Gold/Silver/Critical Minerals
        • Currency
        • Volatility
      • Fixed Income
        • Investment Grade Corporates
        • US Treasuries & TIPS
        • High Yield Corporates
        • Int'l Fixed Income
    • ETF Ecosystem
    • ETFs in Canada
  • Tools
    • ETF Screener
    • ETF Country Exposure Tool
    • ETF Sector Tracker Tool
    • ETF Database Categories
    • Head-To-Head ETF Comparison Tool
    • ETF Stock Exposure Tool
    • ETF Issuer Fund Flows
    • Indexes
    • Mutual Fund To ETF Converter
  • Research
    • ETF Education
    • Equity Investing
    • Dividend ETFs
    • Leveraged ETFs
    • Inverse ETFs
    • Index Education
    • Index Insights
    • Top ETF Sectors
    • Top ETF Issuers
    • Top ETF Industries
  • Webcasts
  • Themes
    • AI ETFs
    • Blockchain ETFs
    • See all Thematic Investing ETF themes
    • ESG Investing
    • Marijuana ETFs
  • Multimedia
    • ETF 360 Video Series
    • ETF of the Week Podcast
    • ETF Prime Podcast
    • Video
  • Company
    • About VettaFi
    • Get VettaFi’ed
  • PRO
    • Pro Content
    • Pro Tools
    • Advanced
    • FAQ
    • Pricing
    • Free Sign Up
    • Login
  1. Index Insights
  2. Insights at a Glance: Market Sell-Off Turns Midstream Market Caps Upside Down
Index Insights
Share

Insights at a Glance: Market Sell-Off Turns Midstream Market Caps Upside Down

Stacey Morris, CFAApr 06, 2020
2020-04-06

To say that a lot has changed in energy since the end of 2019 would be a massive understatement. One interesting development that would be easy to overlook is the shift in the makeup of the North American midstream universe, which includes MLPs and US and Canadian corporations. The transformation over time is evident in the chart below, which is perennially one of our most popular graphics. For years, MLPs represented the bulk of the midstream market cap, with US and Canadian C-Corps on the periphery. For perhaps the first time ever, MLPs are not the largest component of the North American midstream universe by market capitalization, and Canadian midstream C-Corps have taken the top spot. Today, we briefly discuss some of the factors which have contributed to the relative shifts in midstream market capitalization.

This is the image alt text

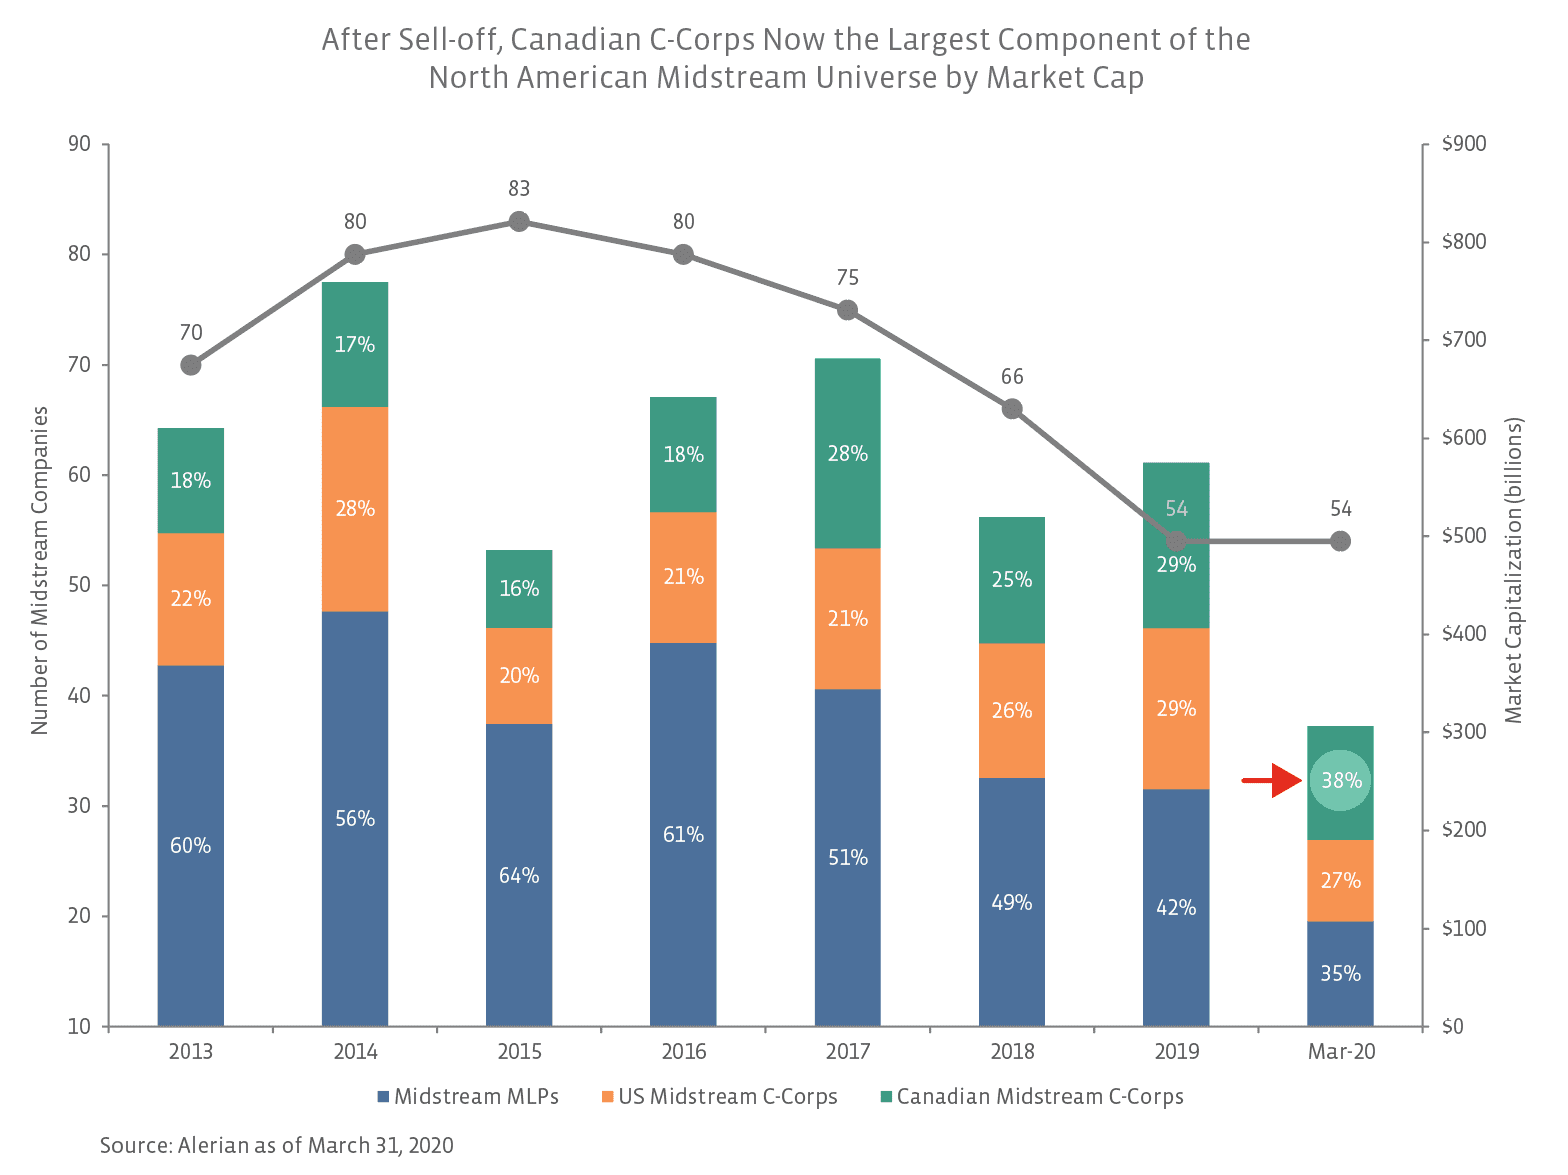
After accounting for the smallest portion of the midstream universe in 2013-16 by market cap, Canadian C-Corps now represent 38% of the universe – more than MLPs at 35% and US C-Corps at 27%. MLPs’ declining share of the midstream market cap has been well documented given the trend of MLP consolidations since 2018 (read more). This has helped US C-Corps gain a greater share and Canadian C-Corps to an extent as well. Recall, Enbridge (ENB) acquired its sponsored MLPs Enbridge Energy Partners and Spectra Energy Partners in December 2018. However, with a static number of companies since year-end 2019, the changes in the first quarter of 2020 largely relate to performance. In addition to the energy and broader market sell-off in March, MLPs were particularly pressured by closed-end funds deleveraging (selling positions to repay debt). With MLPs not widely traded, the added selling pressure in a tough energy tape disproportionately weighed on partnerships, with the Alerian MLP Index (AMZ) declining 58.2% in the first quarter. On the other hand, Canadian midstream names have been resilient. TC Energy (TRP) and ENB were down 9.6% and 20.6% on a price-return basis in the first quarter, respectively, compared to the broad Alerian Midstream Energy Index (AMNA) falling 47.9%. At the end of 2019, ENB and TRP combined to represent 22.9% of the midstream universe by market cap, and on March 31, they accounted for 32.5% of the universe. Stay tuned for a future note discussing more on Canadian midstream performance.

What are the implications of these changes for investors? As discussed in the past, MLPs are not as representative as they used to be and even less representative than just two years ago. For investors allocating to the energy infrastructure space through products, the choice is often between maximizing income (MLP-oriented products) or achieving broad exposure (products with MLPs and corporations). With yields elevated across the space, investors can get healthy yields and broad exposure in products that combine MLPs and C-Corps. For context, the yield of the AMNA Index was 11.3% as of April 3 compared to its five-year average of 6.1%.While midstream market caps will probably continue to fluctuate, Canadian midstream names have clearly become a significant part of the universe, which has performed defensively in a challenging environment.


Content continues below advertisement

» Popular Pages

  • Tickers
  • Articles

Sep 29

A Fixed Income Primer for Constructing Portfolios

Sep 29

Main Management Market Note: September 29, 2023

Sep 29

Higher for Much Longer?

Sep 29

Moving Averages: S&P Ends September Down 4.9%

Sep 29

This Week in ETFs: FormulaFolios Renamed & Adds New Funds

Sep 29

Play Online Car Sales News in These 2 China ETFs

Sep 29

SEC Opens Ethereum Futures ETF Floodgates

Sep 29

VettaFi Voices On: Managing Risk in an Uncertain Economy

Sep 29

SPYI Outperforms SPY in Challenging 3rd Quarter

Sep 29

More Rate Hikes? Watch Treasury ETF USFR

QQQ

Invesco QQQ Trust Series I

SPY

SPDR S&P 500 ETF Trust

VOO

Vanguard S&P 500 ETF

JEPI

JPMorgan Equity Premium...

TLT

iShares 20+ Year Treasury...

SCHD

Schwab US Dividend Equity ETF...

SMH

VanEck Semiconductor ETF

VGT

Vanguard Information...

VTI

Vanguard Total Stock Market...

XLK

Technology Select Sector SPDR...

Loading Articles...
Our Sites
  • VettaFi
  • Advisor Perspectives
  • ETF Trends
Tools
  • ETF Screener
  • Mutual Fund to ETF Converter
  • Head-To-Head ETF Comparison
  • ETF Country Exposure Tool
  • ETF Stock Exposure Tool
  • ETF Database Pro
More Tools
  • Financial Advisor & RIA Center
Explore ETFs
  • ETF News
  • ETF Category Reports
  • Premium Articles
  • Alphabetical Listing of ETFs
  • Browse ETFs by ETF Database Category
  • Browse ETFs by Index
  • Browse ETFs by Issuer
  • Compare ETFs
Information
  • Contact Us
  • Terms of Use and Privacy Policy
  • © 2023 VettaFi LLC. All rights reserved.

Advertisement

Is Your Portfolio Positioned With Enough Global Exposure?

ETF Education Channel

How to Allocate Commodities in Portfolios

Tom LydonApr 26, 2022
2022-04-26

A long-running debate in asset allocation circles is how much of a portfolio an investor should...

Core Strategies Channel

Why ETFs Experience Limit Up/Down Protections

Karrie GordonMay 13, 2022
2022-05-13

In a digital age where information moves in milliseconds and millions of participants can transact...

}
X