
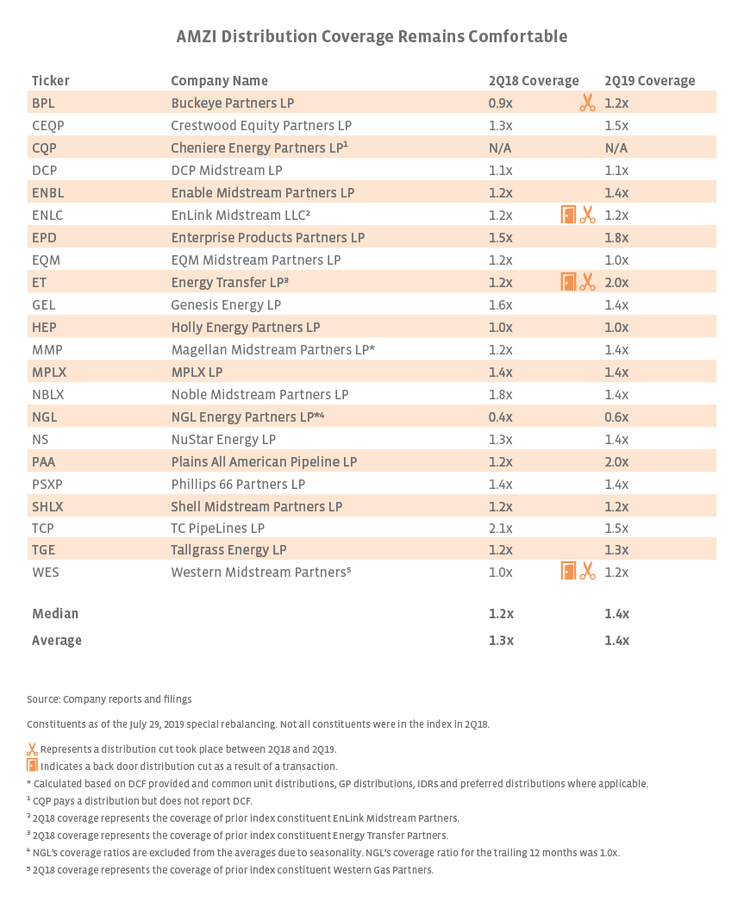
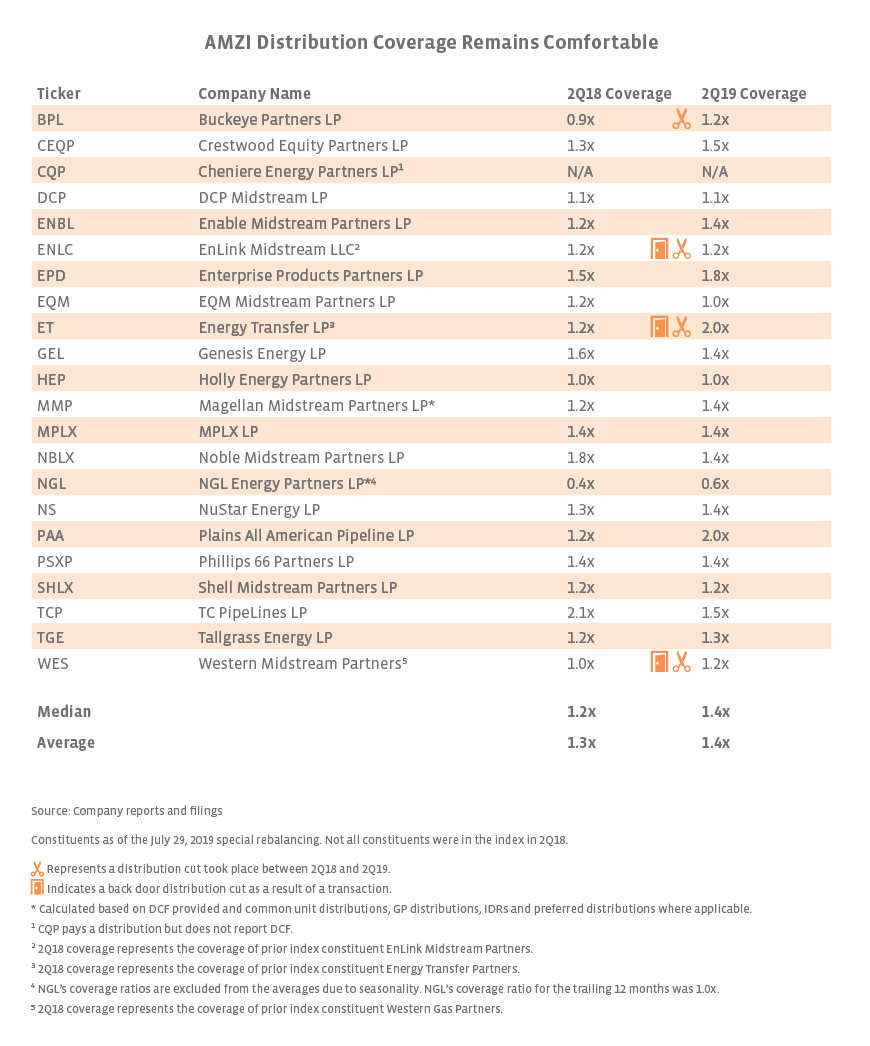
Healthier coverage ratios overall are the result of improvements MLPs have made in recent years, including the elimination of incentive distribution rights(IDRs), leverage reduction, and the shift toward self-funding equity growth capital. These improvements have increased financial flexibility and are reflective of the MLP sector’s progress toward becoming more total return focused (read more). In some cases, improvements in distribution coverage have resulted from distribution cuts, with three of the four cuts since 2Q19 representing backdoor cuts after simplification transactions (read more). We believe MLPs that needed to right-size their distributions have largely done so, and anticipated consolidation transactions are also largely behind the space. Combining these factors, healthier distribution coverage should reassure investors regarding the quality and stability of MLP distributions, even though yields remain elevated. The AMZI Index was yielding 8.8% as of August 23 compared to its five-year average of 7.3% and ten-year average of 6.8%.
While the overall trend for distribution coverage among AMZI constituents is improving, there are some notable company-specific data points to highlight. For example, Enterprise Products Partners (EPD) reported a record-high coverage ratio of 1.8x for 2Q19. In addition to growing their distributions by double-digit percentages on a year-over-year basis, the coverage ratios for Noble Midstream Partners (NBLX), Phillips 66 Partners (PSXP), and Shell Midstream Partners (SHLX) all remain comfortable at 1.2x or higher. TC PipeLines (TCP) saw a notable decline in distribution coverage year-over-year from 2.1x to 1.5x, but 2Q19 coverage is more in line with management’s long-term target of 1.3x-1.4×. Seasonality explains the low quarterly coverage ratios for NGL Energy Partners (NGL), making its coverage ratio of 1.0x for the trailing twelve months a more relevant indicator.
What about MLP payout ratios?
In an effort to provide more generalist-friendly metrics, we first highlighted payout ratios for AMZI constituents in a February post discussing distribution coverage. While payout ratios are typically calculated using earnings, operating cash flow is used as the denominator in the table below. Earnings for MLPs are low due to high investment in growth projects and, consequently, higher depreciation expenses. Payout ratios are essentially the inverse of distribution coverage, with the caveat that distributable cash flow is used for coverage and operating cash flow is used for payout. In the table below, we compare AMZI constituents’ payout ratios for the first half of 2019 to their full year 2018 payout ratio, with 2Q19 coverage included for context.
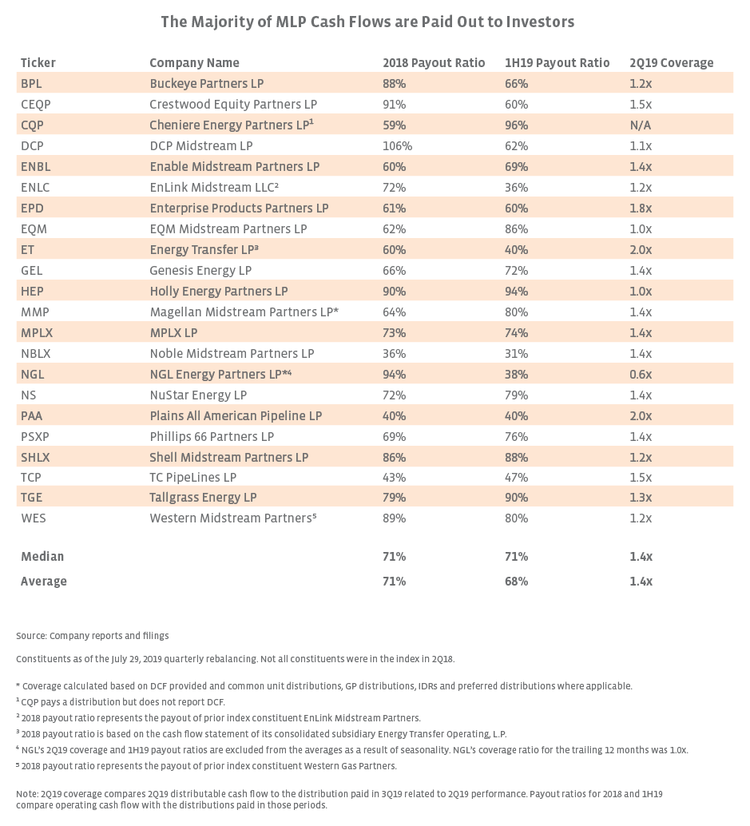
Comparing 2018 with 1H19, the median and average payout ratios are fairly constant. However, the range among MLPs is quite wide (31% to 96%) reflecting company-specific nuances, including historical distribution cuts and the maturity of the MLP. While a payout ratio of ~70% may seem high relative to other sectors, it reflects the generous yields and tax-advantaged structure of MLPs. MLPs can comfortably pay more of their cash flow to investors because they do not pay taxes at the entity level. Admittedly, these factors may limit the usefulness of comparing MLP payout ratios with other sectors, but in general, payout ratios may be more intuitive for a broad audience.
Bottom Line
While distribution coverage remains the best gauge of the health of MLP distributions, payout ratios are another means of determining the affordability of distributions. Improving distribution coverage should give MLP investors confidence when it comes to the quality of the distributions being paid, even as yields remain elevated.

