

MLP payout ratios represent a wide range.
Typically, payout ratios compare dividends to earnings, but for this exercise, we compared distribution payments (including payments for preferred units and payments to the general partner where applicable) to operating cash flow to calculate the payout ratio. Why not use earnings as the denominator? Earnings are less meaningful for MLPs given typically elevated depreciation expense due to hefty investment in growth projects. Using earnings would distort the picture, and it would seem that MLPs were paying out more cash than they were generating. We acknowledge that this is a shortcoming in making MLPs truly comparable to other investments with payout ratios based on earnings, but a payout ratio based on operating cash flow is likely more helpful than distribution coverage alone. Additionally, to provide more context and cut through potential quarterly noise or seasonality for some MLP businesses, the table below includes full-year 2018 payout ratios in addition to the 4Q18 values.
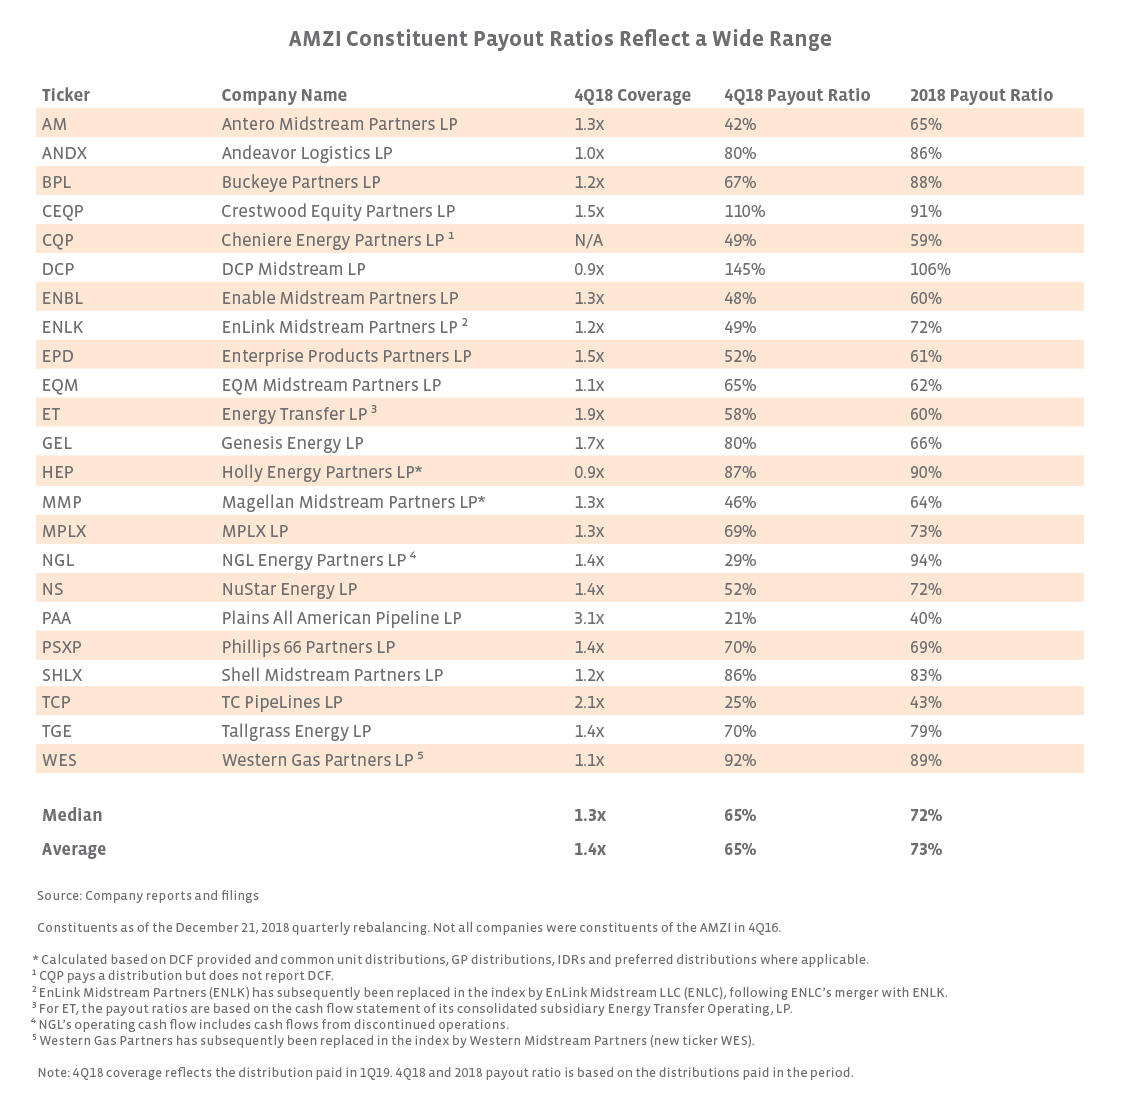
To further clarify, the distribution coverage calculated above compares the distributable cash flow generated in 4Q18 with the distribution based on 4Q18 performance but paid in 1Q19. The payout ratios below compare the operating cash flow generated in the quarter with the distribution paid in the quarter. In other words, for 4Q18, the payout is based on the distribution paid in 4Q18 related to 3Q18 performance.
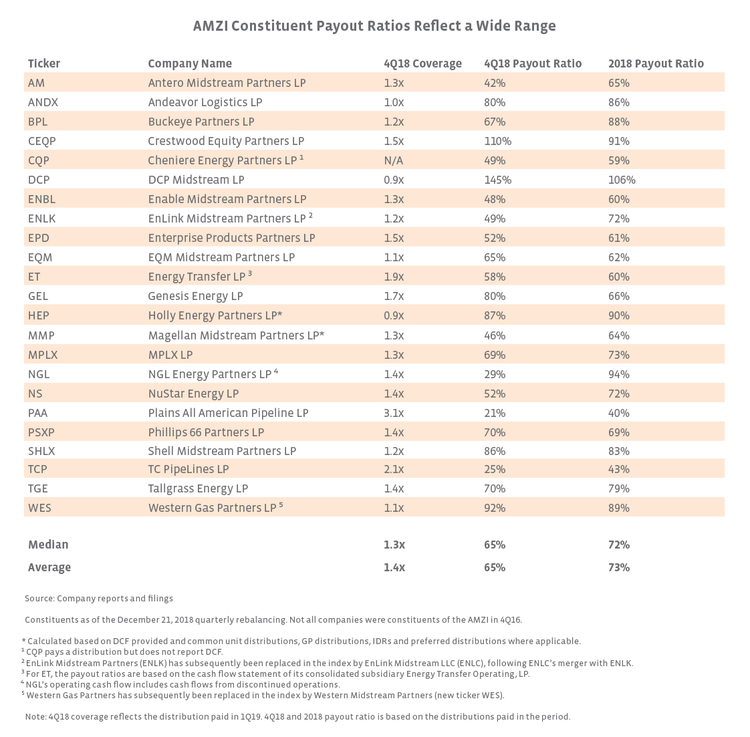
While there is a broad range among constituents, payout ratios overall look fairly comfortable based on the average of 65% for 4Q18 and 73% for the year. Keep in mind the yield on the AMZI Index as of Friday was 7.68%. The payout ratios likely seem high compared to other industries, but other industries have more modest yields and have to pay taxes. If we take utilities as an example, 2018 payout ratios based on dividends and operating cash flow averaged only 30% for the 28 constituents of the S&P 500 Utilities Index, and the yield for the index was only 3.47% as of Friday.
Unsurprisingly, the companies with low coverage tend to have high payout ratios, but there are other nuances to the data as well. DCP stands out for having payout ratios in both periods that exceed 100% but has incentive distribution rights (IDRs) in the high splits, preferred units, and has not cut its distribution – all of which leads to a larger numerator. We discussed specific 4Q18 headwinds for DCP above. Crestwood Equity Partners’ (CEQP) payout ratio exceeded 100% in 4Q18 but was below 100% for the full year. CEQP does not have IDRs, but it does have preferred units. NGL Energy Partners (NGL), which is at the high-end for full-year payout ratios, has two classes of preferred units and IDRs. On the other hand, Plains All American (PAA) has a relatively low payout ratio, but PAA cut its distribution twice and has kept it flat since. Clearly, each company has its nuances. Payout ratios are likely to shift over time as distribution policies change, new projects come online, assets are bought or sold, etc. As such, today’s post sets a baseline for payout ratios that we will update in the future.
Bottom Line
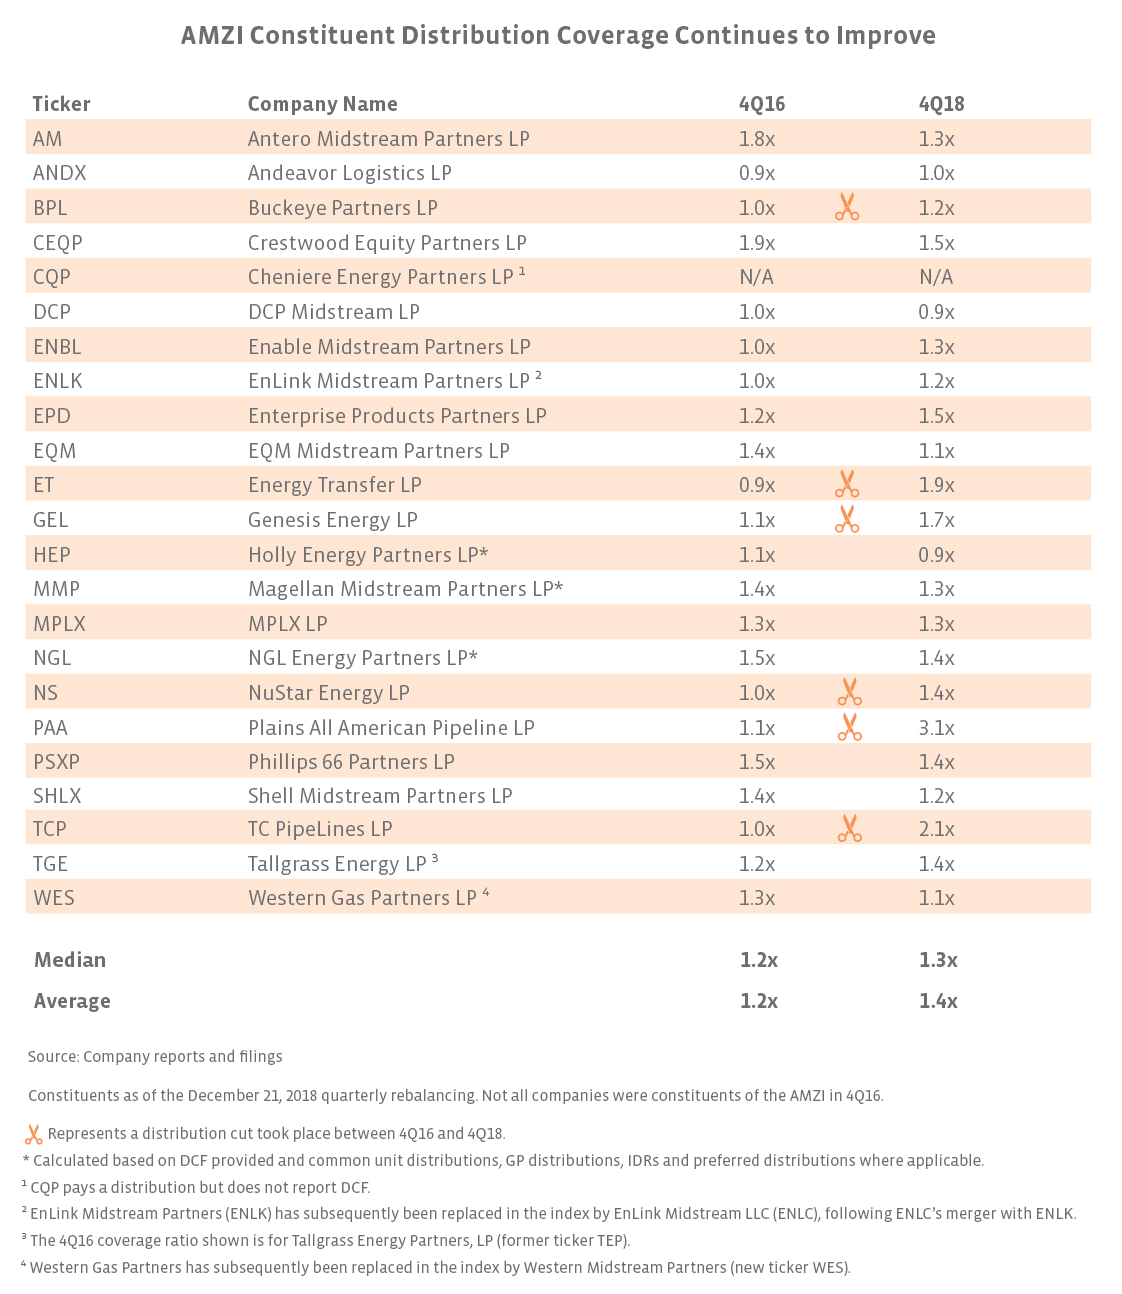
Improving coverage ratios should give investors comfort around the ability of MLPs to afford their distributions. Payout ratios may look high relative to other sectors but should be viewed in the context of the sector’s generous yields and the fact that MLPs do not pay federal taxes. With solid fundamentals and expectations for growing cash flows as projects are brought online, there is certainly potential for these metrics to continue to improve.

