ETFdb Logo
ETFdb Logo
  • ETF Database
  • Channels
    • Themes
      • Active ETF
      • Artificial Intelligence
      • Beyond Basic Beta
      • China Insights
      • Climate Insights
      • Core Strategies
      • Crypto
      • Direct Indexing
      • Disruptive Technology
      • Energy Infrastructure
      • ETF Building Blocks
      • ETF Investing
      • ETF Education
      • ETF Strategist
      • Financial Literacy
      • Fixed Income
      • Free Cash Flow
      • Innovative ETFs
      • Institutional Income Strategies
      • Leveraged & Inverse
      • Managed Futures
      • Market Insights
      • Modern Alpha
      • Multifactor
      • Responsible Investing
      • Retirement Income
      • Tax Efficient Income
    • Asset Class
      • Equity
        • U.S. Equity
        • Int'l Developed
        • Emerging Market Equities
      • Alternatives
        • Commodities
        • Gold/Silver/Critical Minerals
        • Currency
        • Volatility
      • Fixed Income
        • Investment Grade Corporates
        • US Treasuries & TIPS
        • High Yield Corporates
        • Int'l Fixed Income
    • ETF Ecosystem
    • ETFs in Canada
  • Tools
    • ETF Screener
    • ETF Country Exposure Tool
    • ETF Sector Tracker Tool
    • ETF Database Categories
    • Head-To-Head ETF Comparison Tool
    • ETF Stock Exposure Tool
    • ETF Issuer Fund Flows
    • Indexes
    • Mutual Fund To ETF Converter
  • Research
    • ETF Education
    • Equity Investing
    • Dividend ETFs
    • Leveraged ETFs
    • Inverse ETFs
    • Index Education
    • Index Insights
    • Top ETF Sectors
    • Top ETF Issuers
    • Top ETF Industries
  • Webcasts
  • Themes
    • AI ETFs
    • Blockchain ETFs
    • See all Thematic Investing ETF themes
    • ESG Investing
    • Marijuana ETFs
  • Multimedia
    • ETF 360 Video Series
    • ETF of the Week Podcast
    • ETF Prime Podcast
    • Video
  • Company
    • About VettaFi
    • Get VettaFi’ed
  • PRO
    • Pro Content
    • Pro Tools
    • Advanced
    • FAQ
    • Pricing
    • Free Sign Up
    • Login
  1. Index Insights
  2. MLP Distribution Coverage: How and Why It’s Changed
Index Insights
Share

MLP Distribution Coverage: How and Why It’s Changed

Stacey Morris, CFAAug 27, 2018
2018-08-27

While we recap distribution growth quarterly (2Q18 recap), two quarters have passed since we last discussed distribution coverage (click here). In today’s post, we show historical quarterly coverage ratios for current constituents of the Alerian MLP Infrastructure Index (AMZI) for 4Q16 and the three most recent quarters. While the data shows improvement for the group, there are some nuances in the changes to coverage ratios for certain constituents, including improvement following distribution cuts or improvement due to the pursuit of equity self-funding. Others have seen coverage ratios decrease as their distributions have increased.

As a reminder, distribution coverage (or coverage ratio) compares distributable cash flow (DCF) generated in a period to total cash distributions paid for that period of performance. A coverage ratio above 1.0x tends to give investors comfort around an MLP’s ability to continue paying or growing its quarterly distribution. On the other hand, a coverage ratio (persistently) below 1.0x can be concerning for investors.

What are the company-level takeaways?

While there has not been much change in the average and median for the group over time, coverage ratio changes for the individual constituents belie the relatively steady average and mean. Some MLPs have provided fairly consistent coverage ratios, while others have seen more notable changes. Unfortunately for investors, improvement in coverage ratios have come at a cost in some cases, with distribution cuts noted for eight names in the table. In other cases, distribution coverage has increased as companies have moved toward self-funding the equity portion of their capital spending. Companies pursuing equity self-funding include Enterprise Product Partners (EPD), MPLX (MPLX), and Magellan Midstream Partners (MMP), which aligns with their comfortable coverage ratios over the time periods shown and an improvement for EPD since it announced its strategy to pursue equity self-funding in October 2017.

<p>AM: 29.7%</p>
<p>PSXP: 22.3%</p>
<p>SHLX: 20.0%</p>
<p>EQM: 16.6%<u>.“>Double-digit distribution growth
 has led to moderating coverage ratios for ”text-decoration: underline; color: #3366ff;">Antero Midstream (AM), Phillips 66 Partners (PSXP), Shell Midstream (SHLX) and EQT Midstream (EQM), but 2Q18 coverage was still 1.2x or greater for these names. 

This is the image alt text

What are the takeaways for the group more broadly?

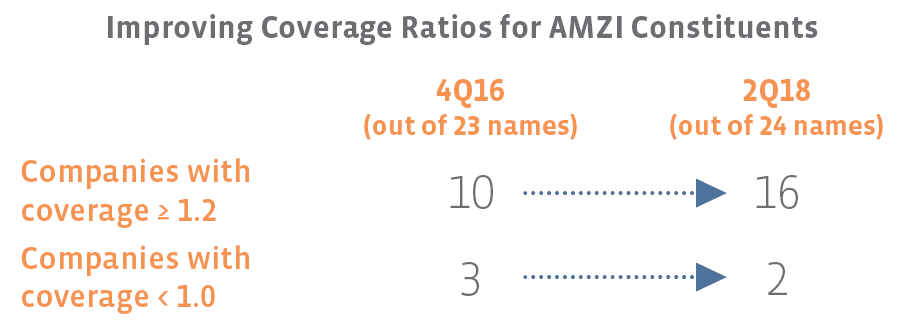
Comparing 4Q16 to 2Q18, the average for this group has remained steady, while the median has slightly improved. That said, the data below seems more telling of the improvement for the group. In summation, the number of companies with coverage of 1.2x or better has increased from 4Q16, while the number of names with coverage below 1.0x has decreased. For investors, these numbers are both trending in the right direction in terms of providing more comfort around the ability of these MLPs to pay their distributions or increase them. The table above shows the simple average for each quarter, but the weighted average coverage ratio for 2Q18 is also 1.2x based on the index weightings as of the August 10th special rebalancing.


Content continues below advertisement

This is the image alt text

Cautions to keep in mind

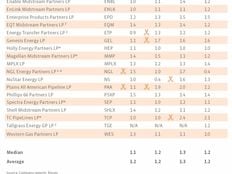
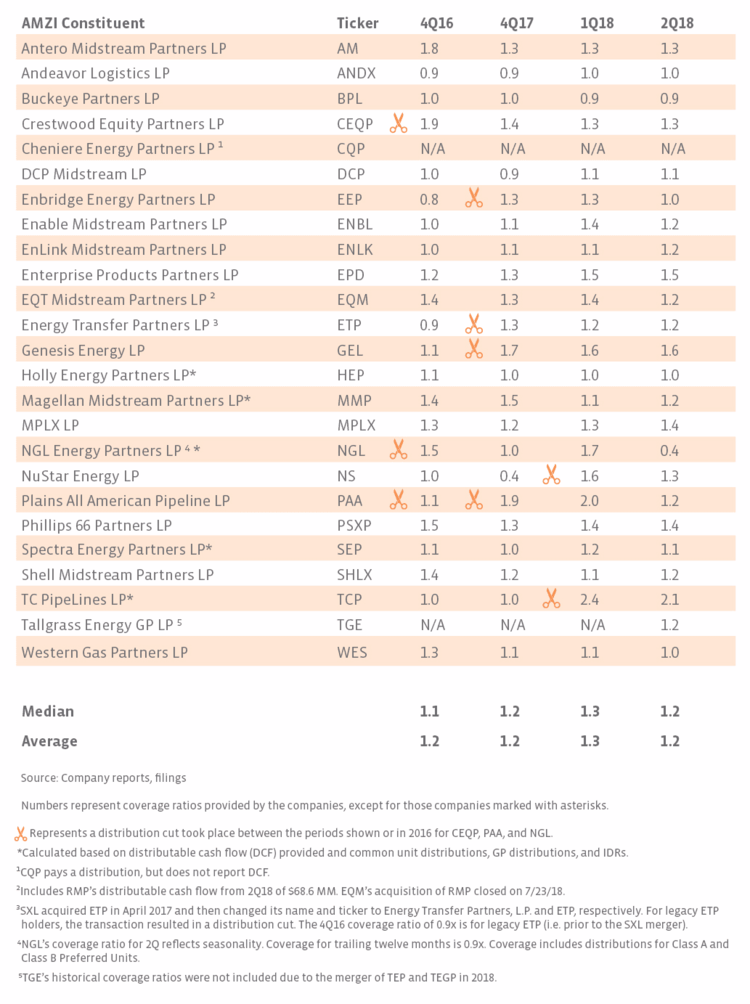
As a metric that does not comply with Generally Accepted Accounting Principles (GAAP), MLPs have latitude in how they calculate DCF. Among different MLPs, DCF may not be calculated in the same way, implying that the coverage ratios shown are not all apples to apples. That said, comparing coverage ratios over time for the same company should provide a clear comparison for that individual company. For businesses with seasonality, coverage may fluctuate between quarters making an annual or trailing 12-month coverage ratio more meaningful. As noted in the table, NGL Energy Partners’ (NGL) trailing 12-month coverage ratio is 0.9x – much higher than the 0.4x shown for 2Q18. NGL has moved to reduce the seasonality of its business with the sale of its retail propane business, which closed last month.

Rounding coverage to the tenths place also smooths the data. However, we think presenting the data to the hundredth place implies more accuracy for the data broadly than is warranted given the caveats mentioned above, namely that DCF is not a standard measure.

Bottom line

Looking at the current AMZI constituents, distribution coverage has generally improved from 4Q16 to 2Q18, though in some cases that improvement was the result of painful cuts to lower the distribution to a more sustainable level. Each MLP’s coverage trends are somewhat unique, whether coverage was steady, decreased due to distribution growth, or coverage improved because of cuts, a shift to self-funding, or an effort to be more conservative. However, for MLP investors, the improvements discussed or the absolute numbers for 2Q18 hopefully help address concerns about coverage and the ability of MLPs to pay and potentially grow their distributions.

» Popular Pages

  • Tickers
  • Articles

Sep 28

Andrew Beer: Avoid the “Worst Heuristic Bias” in Investing

Sep 28

Today's Economy is a Gift to High Yield

Sep 28

The Quality Dividend ETF OUSM Is Nearing RSI Signal

Sep 28

BlackRock Lists Active Equity Premium Income ETF

Sep 28

Examining the Women Factor

Sep 28

Rising Water Costs Globally Spell Opportunity for This ETF

Sep 28

Harbor Commodity ETF Supported by Strong Tilt Toward Energy

Sep 28

VanEck Ethereum Futures ETF Could Launch Soon

Sep 28

Avantis Launches U.S. Large Cap Equity ETF

Sep 28

Capital Group Launches 5 New Active ETFs

QQQ

Invesco QQQ Trust Series I

SPY

SPDR S&P 500 ETF Trust

VOO

Vanguard S&P 500 ETF

JEPI

JPMorgan Equity Premium...

TLT

iShares 20+ Year Treasury...

VGT

Vanguard Information...

SCHD

Schwab US Dividend Equity ETF...

VTI

Vanguard Total Stock Market...

SDS

ProShares UltraShort S&P500

XLK

Technology Select Sector SPDR...

Loading Articles...
Our Sites
  • VettaFi
  • Advisor Perspectives
  • ETF Trends
Tools
  • ETF Screener
  • Mutual Fund to ETF Converter
  • Head-To-Head ETF Comparison
  • ETF Country Exposure Tool
  • ETF Stock Exposure Tool
  • ETF Database Pro
More Tools
  • Financial Advisor & RIA Center
Explore ETFs
  • ETF News
  • ETF Category Reports
  • Premium Articles
  • Alphabetical Listing of ETFs
  • Browse ETFs by ETF Database Category
  • Browse ETFs by Index
  • Browse ETFs by Issuer
  • Compare ETFs
Information
  • Contact Us
  • Terms of Use and Privacy Policy
  • © 2023 VettaFi LLC. All rights reserved.

Advertisement

Is Your Portfolio Positioned With Enough Global Exposure?

ETF Education Channel

How to Allocate Commodities in Portfolios

Tom LydonApr 26, 2022
2022-04-26

A long-running debate in asset allocation circles is how much of a portfolio an investor should...

Core Strategies Channel

Why ETFs Experience Limit Up/Down Protections

Karrie GordonMay 13, 2022
2022-05-13

In a digital age where information moves in milliseconds and millions of participants can transact...

}
X