
When getting bad news (medical or financial), the questions are basically the same: How bad is it? How long will the recovery take? What will my life look like in five years?
How Bad Is It?
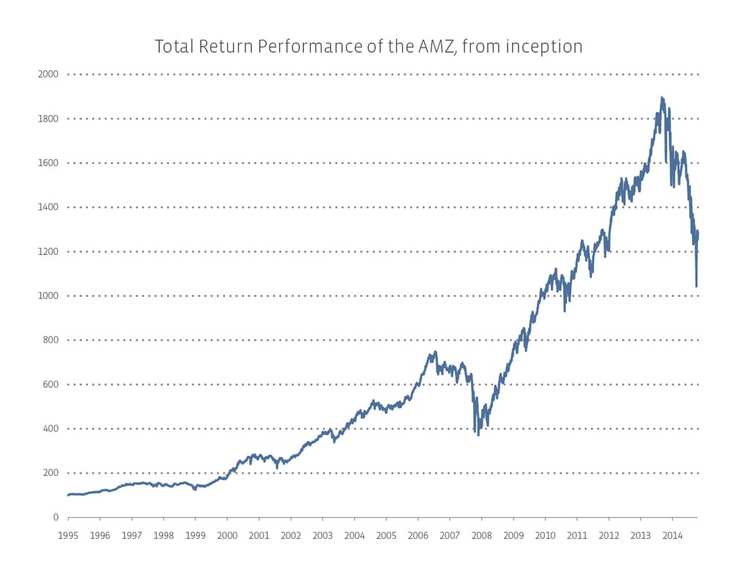
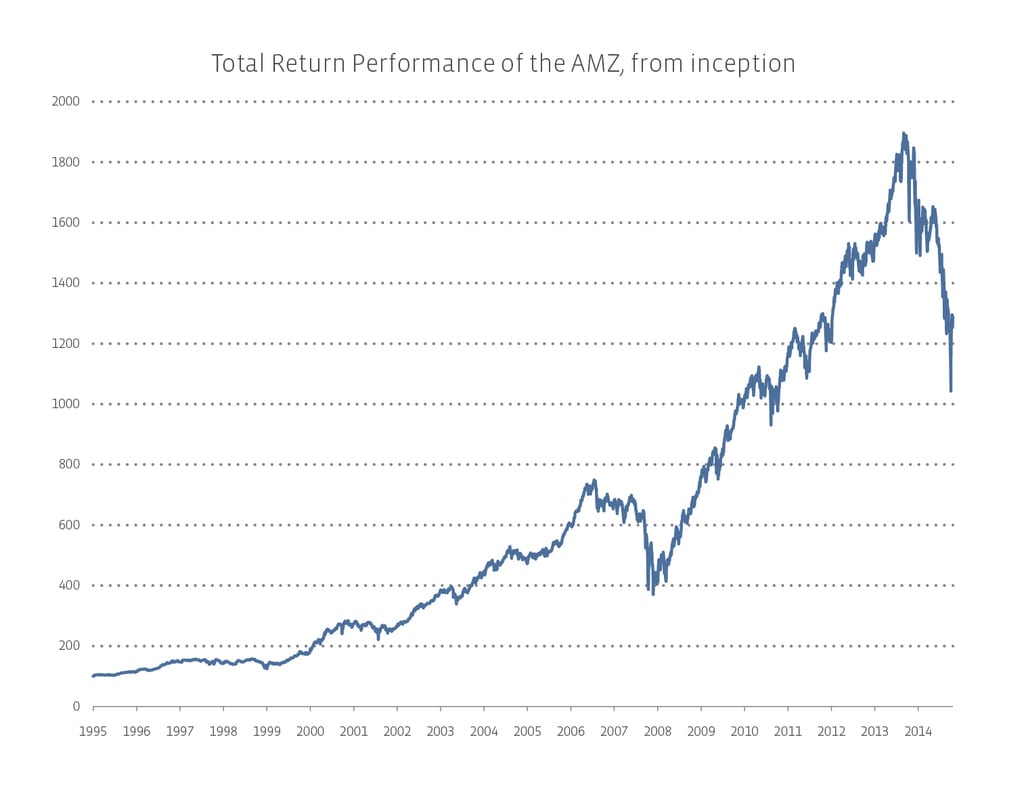
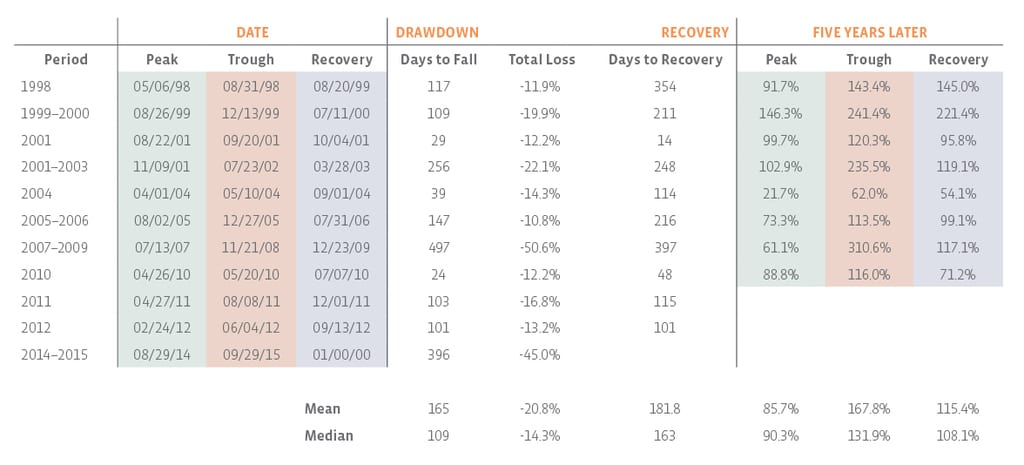
In finance, we measure how bad things are by looking at maximum drawdowns. Drawdowns can only be formally determined after the fact, as they are defined by a stock or index falling from its previous high and returning to that level. The previous high is referred to as the peak, and the lowest point reached is referred to as the trough. The final trough value can’t be known until the recovery is complete.
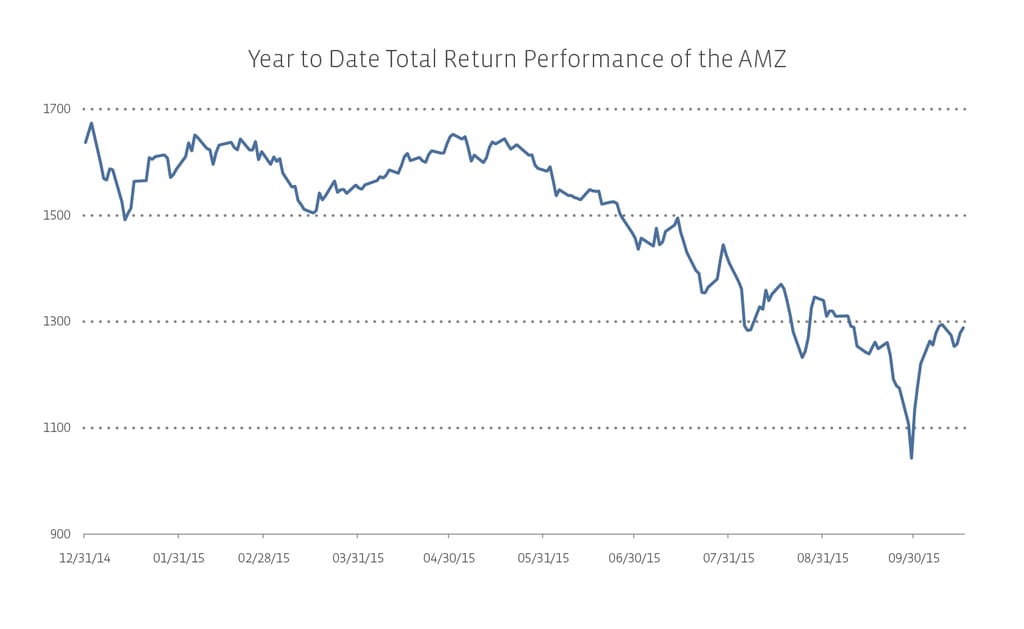
The chart looks scary—it looks like MLPs have never performed worse, but that’s actually not true. The maximum drawdown was 50.6% during 2008-2009. Today, although MLPs have not returned to previous levels, peak to trough is 45.0%. Even so, as of yesterday (October 26th), they have bounced 13.5%.
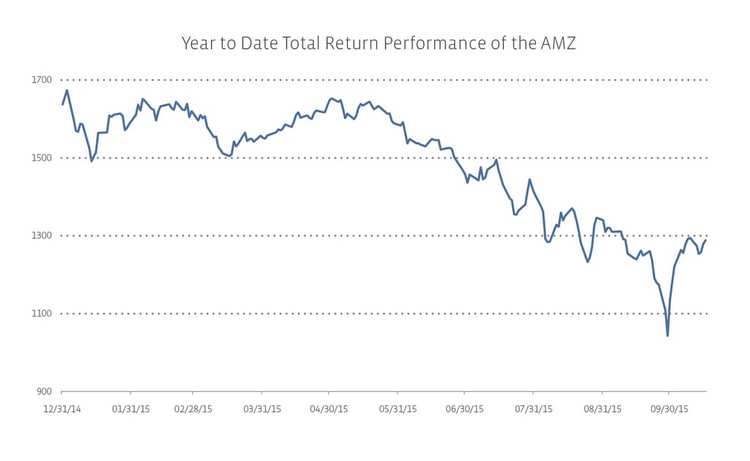
During the recent slump, we have seen two micro drawdowns. From February 20th to March 16th, the AMZX fell 8.5%, and recovered by the end of April. More dramatically, from September 21st to September 29th, in just over a week, the AMZX fell 17.3%. It recovered just as quickly—by October 5th.
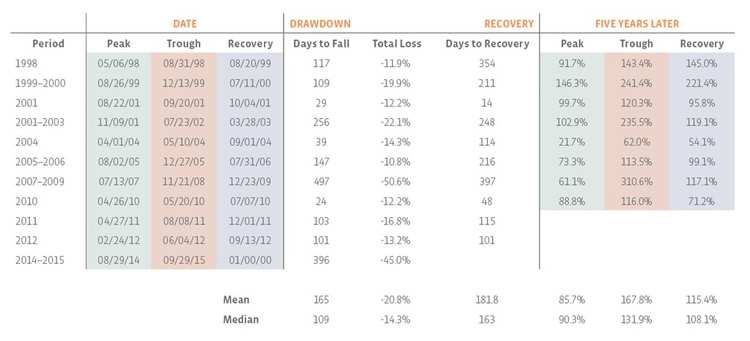
“Not as bad as it could be” doesn’t actually provide much comfort in the moment, however, because it’s so easy to see how many other times it wasn’t as bad as this. In the past 20 years, there have been 11 times that MLPs saw a maximum drawdown greater than 10%. The average loss was just over 20%, and MLPs took a little less than six months to fall.
How Long Will the Recovery Take?
This question presumes that the worst is over. Alerian never provides market predictions, but the consensus is that we are closer to the trough than the peak.
Of the 11 periods studied, recovery times ranged from over a year (post-financial crisis) to just two weeks (post-9/11 recovery). Those periods are perhaps not representative, since MLPs took more than 16 months to reach the trough during the financial crisis but only four weeks surrounding 9/11. To return to last year’s all-time high, MLPs will need to climb an additional 60.2%.
Recoveries depend on too many factors to make accurate predictions. A change in political environment, a move in interest rate expectations, a sustained change in production levels, or general market contagion could all impact (positively or negatively) the length of the recovery.
What Will MLPs Look Like in Five Years?
Good news! MLPs have survived drawdowns 100% of the time. (Some individual MLPs have not. Then again, even when MLPs as a whole are healthy, some have not survived.) Past performance may not be indicative of future results, but no one at Alerian has any reason to believe that current performance will lead to dissolution of the structure.
However, everyone at Alerian will tell you that an investment in MLPs should be a long-term investment. Fundamentally, infrastructure assets simply take time to build. The fastest I’ve heard of a pipeline being completed, from ideation to in-service date, was 18 months, but two to three years is a more typical time period, if there are no delays.
On a technical or statistical basis, the unlucky but wise investor who had bought at every single peak in the past 20 years, but held on for the following five years, despite the drawdown, would have made an average of 85.7%. Admittedly, the investor with the brass and crystal balls to invest at the trough would have made an average of 167.8% over the next five years. A thoughtful investor might realize she is unlikely to be either of the above and decides to invest on the day MLPs have fully recovered. On average, that strategy returns 115.4% over five years. The lazy investor, who simply invested on a random day in the past 20 years, but held for five years, would have made 122.6%.
Overall, if you’re concerned about MLP drawdowns, it doesn’t really matter if you’re unlucky, thoughtful, brassy, or just lazy. Five years on, everyone made money. Again, past performance may not be indicative of future results. It’s worth noting that only recently have many retail and institutional investors added an MLP allocation to their portfolios. A cut to their equities or alternatives bucket could lead to fund outflows, making this and future recoveries choppier than before. Solar and wind technologies are also more advanced than they have ever been. A renewable revolution could make hydrocarbon infrastructure obsolete. While even the most bullish of renewable projections don’t show that happening anytime soon, history may eventually stop repeating itself.

