

Given changes in the space, are historical average EBITDA multiples relevant?
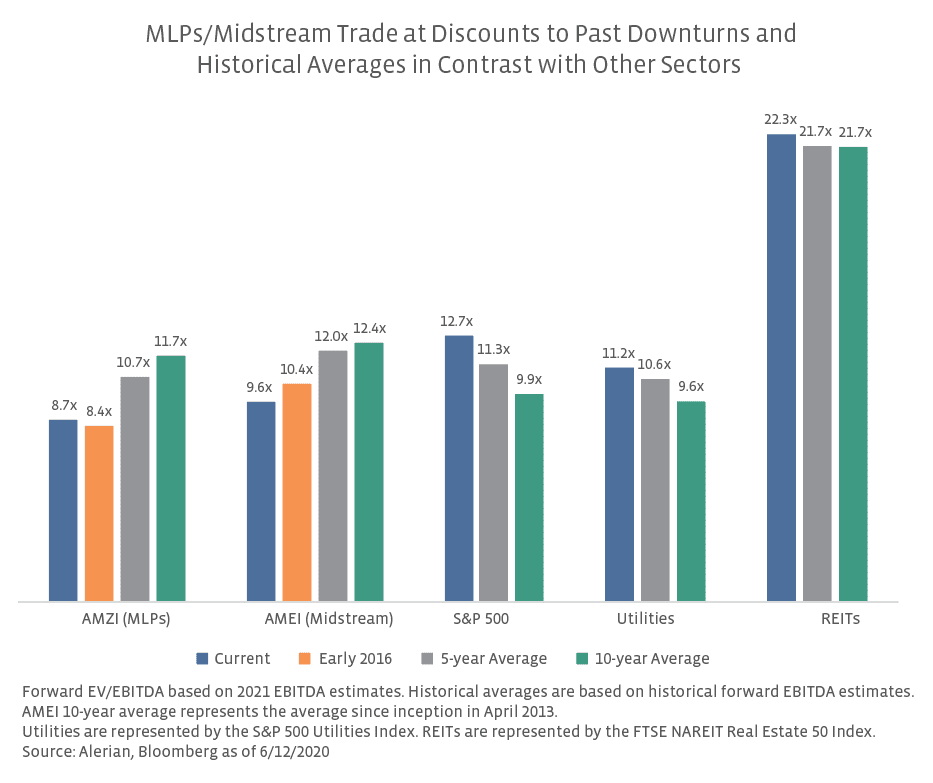
With significant changes in midstream over the last five years, let alone ten years, the merit of comparing current valuations to historical averages is open to debate. At a high level, the makeup of the North American midstream universe has changed significantly in recent years. At the end of 2014, there were 80 midstream companies, and MLPs accounted for 56% of the midstream market cap. At the end of last month, there were 53 midstream companies, and MLPs represented 40% of the universe by market cap. Some assets, particularly interstate natural gas pipelines, that were held in an MLP structure in the past are now held by C-Corps, which may weaken the historical comparison for both MLP and midstream indexes. Until mid-2018, the AMEI Index included utilities that were also general partners of MLPs, which can distort historical comparisons given that utilities have traded at lower EV/EBITDA multiples compared to MLPs and midstream as shown in the chart above. At the company level, midstream has shifted from focusing on distribution growth and a reliance on equity capital markets to now largely self-funding equity and prioritizing financial flexibility and reducing leverage. While historical averages may have shortcomings, they provide a benchmark for making comparisons and are perhaps more useful when considered in broader context.
Framing the debate: Should midstream multiples have expanded or compressed?
Setting aside energy headwinds stemming from the demand impact of COVID-19, when evaluating current EBITDA multiples relative to historical averages, a key consideration is whether multiples should have expanded or compressed over time. MLPs and midstream corporations have taken steps in recent years to improve their positioning and clean house in ways that could support an argument for expanded multiples. In the MLP space, incentive distribution right (IDR) eliminations have been a positive step to improving corporate governance and lowering the cost of capital (read more). Although more progress could be made to better governance, 88% of the AMZI by weighting has eliminated IDRs compared to 34% having eliminated IDRs at the end of 2014. Furthermore, MLPs and midstream corporations have largely shifted toward self-funding the equity component of growth capital spending in recent years. Though, it would be remiss to not mention that C-Corp ONEOK (OKE) announced an equity offering last week.
On the other hand, one could also argue that MLP and midstream multiples should have rerated lower compared to historical metrics. Steady distribution payments were a justification for premium multiples in the midstream space, but after a slew of cuts to payouts in recent years and several in 1Q20, a lack of distribution stability for the space overall could drive multiple compression. To better evaluate this, EV/EBITDA multiples for large MLPs without any distribution cuts were examined. Last week, these names were trading more than 2.0 turns below their five-year average but were trading at a premium relative to the AMZI Index. Beyond distribution cuts, other factors could contribute to more compressed multiples for midstream. Increased volatility in midstream equities against a backdrop of wild swings in oil prices since 2014 could also merit lower multiples relative to the past. Investment-grade credit ratings can garner premium multiples, and a lower investment-grade weighting in the AMZI could argue for multiple compression. Of note, the investment-grade weighting for the AMEI was 77.1% at the end of March 2020, marking a substantial improvement from 63.1% at the end of 2015.
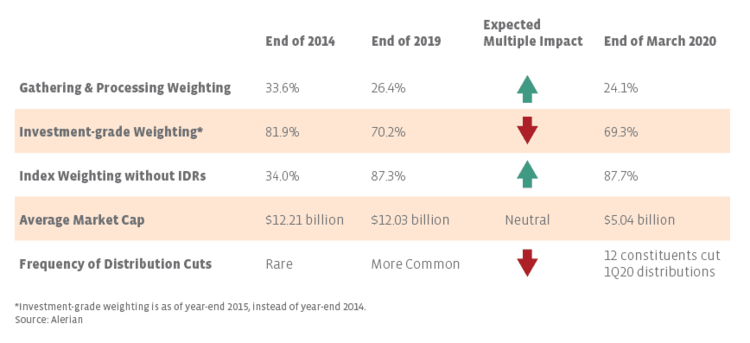
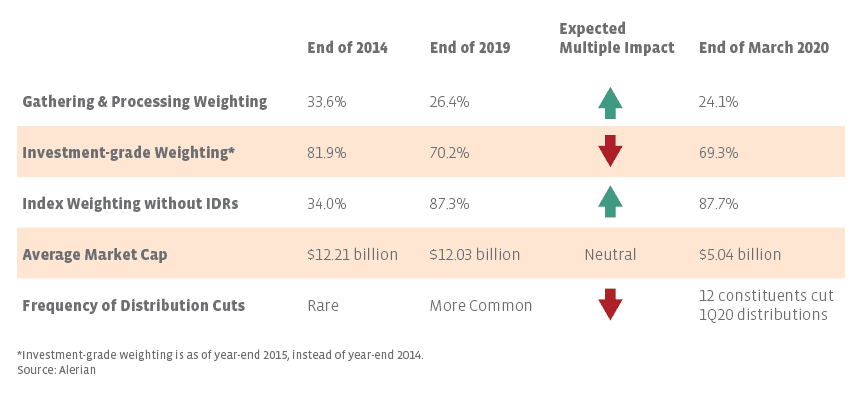
To better exemplify the shift in metrics and implications for multiples, the table below looks at several data points for the AMZI from the end of 2014 to the end of 2019 that could cause multiples to compress or expand. Data for the end of the first quarter is included for reference. Aside from distribution track records, investment-grade weightings, and IDR eliminations, sector exposures and company size could also impact multiples. For example, the weight of gathering and processing (G&P) names has decreased since 2014, which would likely argue for multiple expansion given the greater commodity price exposure in G&P and lower multiple for G&P relative to pipeline transportation. While admittedly simplistic, a higher average market cap could indicate larger companies warranting a size premium, but the average market cap was relatively static from the end of 2014 to the end of 2019. While these are just some of the variables that could impact multiples, there have been changes that could have negative and positive implications for multiples. Balancing these developments with others to determine if multiples should expand or compress is probably more art than science.
What could restore MLP and midstream multiples to past levels?
Admittedly, the correct multiple for midstream is fairly subjective, but if historical averages are more correct than current multiples, what could restore midstream and MLPs to past levels aside from an improvement in the macro energy landscape? Increased fund flows into MLPs would be necessary, and those depend ultimately on investor interest. Perhaps incremental buyers will be attracted to the healthy yields with less perceived downside risk given several cuts in 1Q20. As seen in the past, a major private equity transaction could help highlight the value in midstream and serve as a catalyst, but current macro headwinds may impair deal making (read more). Expanding multiples could result from steady execution by companies and stable dividends. Increasing free cash flow generation, discussed Tuesday, could support reduced leverage in the near term and buybacks or dividend increases in the future, which may also attract investors and lead to improved multiples. In short, there are many factors that could drive midstream multiples back up to their historical averages, with some taking more time than others.
Bottom line
Admittedly, changes in the midstream space from the makeup of the universe to a reworking of capital allocation priorities at the company level may limit the usefulness of historical average valuations. However, while distribution cuts and volatility may be justifications for today’s lower multiples beyond current macro headwinds, these may be offset by positive developments related to corporate governance, leverage, equity self-funding, and free cash flow generation. Ultimately, it is up to investors to decide whether the space is properly valued.

