

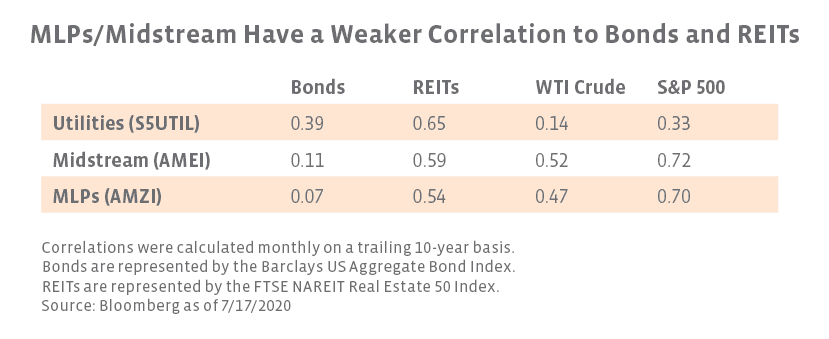
In addition to their attractive income, midstream and utilities have been leveraged by investors for their diversification benefits given their low correlations to other asset classes and for their real asset exposure. The table below shows the 10-year correlations of midstream, MLPs, and utilities to other sectors and asset classes. As shown, midstream has a lower correlation to other income-oriented sectors such as REITs and bonds. However, utilities provide a lower correlation to US equities, and as one would expect, utilities have a much lower correlation to oil prices relative to midstream.

What differentiates utilities from midstream?
Utilities and midstream have often been thought of as adjacent industries since companies within both sectors operate real assets tied to energy demand with stable cash flows from regulated rates supporting dividends. However, there are a variety of factors that separate midstream and utilities. Among the most notable of these is the relationship with broader energy and the defensive nature of utilities amid market headwinds.
Both industries are dependent on energy demand, but midstream has more exposure to energy production trends. This has led to a stronger correlation between midstream and oil prices, as seen above, resulting in utilities performing more defensively in volatile commodity price environments. During the 2014-16 oil price downturn, utilities significantly outperformed midstream, increasing 11.3% on a total-return basis from WTI crude’s peak to its trough compared to 49.3% and 54.8% declines for the AMEI and AMZI, respectively. Conversely, AMEI and AMZI outperformed utilities by a wide margin as oil prices recovered. From WTI crude’s relative low in early 2016 to its October 3, 2018, high of over $76 per barrel, AMEI and AMZI increased 77.4% and 69.9% respectively on a total-return basis compared to 26.4% for utilities. With oil fundamentals on more solid footing today (read more), investors who are optimistic on the potential for a continued energy recovery would likely prefer midstream over utilities. On the other hand, utilities tend to perform defensively during periods of broader market volatility given weaker correlations to the S&P 500. For example, during the S&P 500’s 2007-09 peak-to-trough decline of 55.3%, utilities only fell 42.9% on a total-return basis. Utilities also outperformed the S&P 500 during the market volatility earlier this year as shown in the chart below. Investors anticipating broader market headwinds may prefer utilities for their defensiveness. (To be clear, midstream is defensive within the energy sector, but it is not defensive in the wake of broader market volatility like utilities.)
There are several other small but notable factors that set midstream apart from utilities. In regard to rate regulation, the governmental agency responsible for interstate pipeline regulation, the Federal Energy Regulatory Commission (FERC), aims to support safe and efficient energy transportation while ensuring a just and reasonable rate of return to midstream operators (read more). Conversely, utilities typically have an antagonistic pricing relationship with state public utilities commissions, which aim to protect consumers.
Many utility companies have previously expanded into midstream, particularly natural gas pipelines, to generate growth and secure gas supply, but that overlap is shrinking as companies focus on their core businesses. CNP recently noted that it is still exploring options regarding its 53.7% stake in midstream MLP Enable Midstream Partners (ENBL), in which co-general partner OGE Energy Corp (OGE) also owns a 25.5% stake. D has agreed to sell its midstream business, which is primarily comprised of gas transmission and storage infrastructure, to an affiliate of Berkshire Hathaway. D and its fellow utility partner Duke Energy (DUK) also cancelled the proposed Atlantic Coast natural gas pipeline (read more). Although it sold its natural gas storage business in February 2019, Sempra Energy (SRE) serves as a notable counterexample to this trend given its midstream operations through Sempra LNG and its 66.7% stake in Mexican energy infrastructure company IEnova (IENOVA).
Utilities boast better performance but also premium valuations.
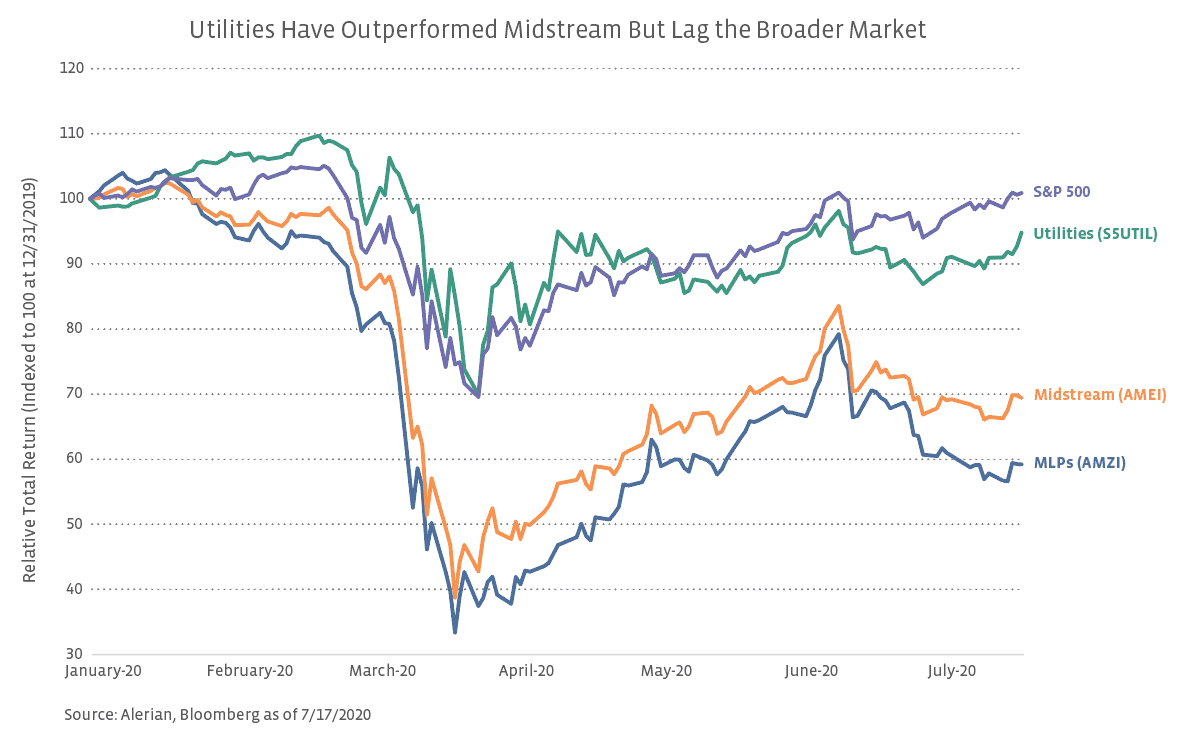
This year has been a rollercoaster for the broader market so far, and energy infrastructure and utilities have not been immune to this volatility. However, there has been a substantial performance difference between the two sectors. As seen as the chart below, utilities have significantly outperformed both the AMEI and AMZI year-to-date but have underperformed the S&P 500 by just over 600 basis points through July 17 on a total-return basis after outperforming during the volatility earlier this year. The performance disparity between utilities and midstream is not surprising given the 33.5% decline in WTI crude prices so far this year along with the negative macro headlines for midstream surrounding dividend cuts, regulatory news, and production shut-ins.

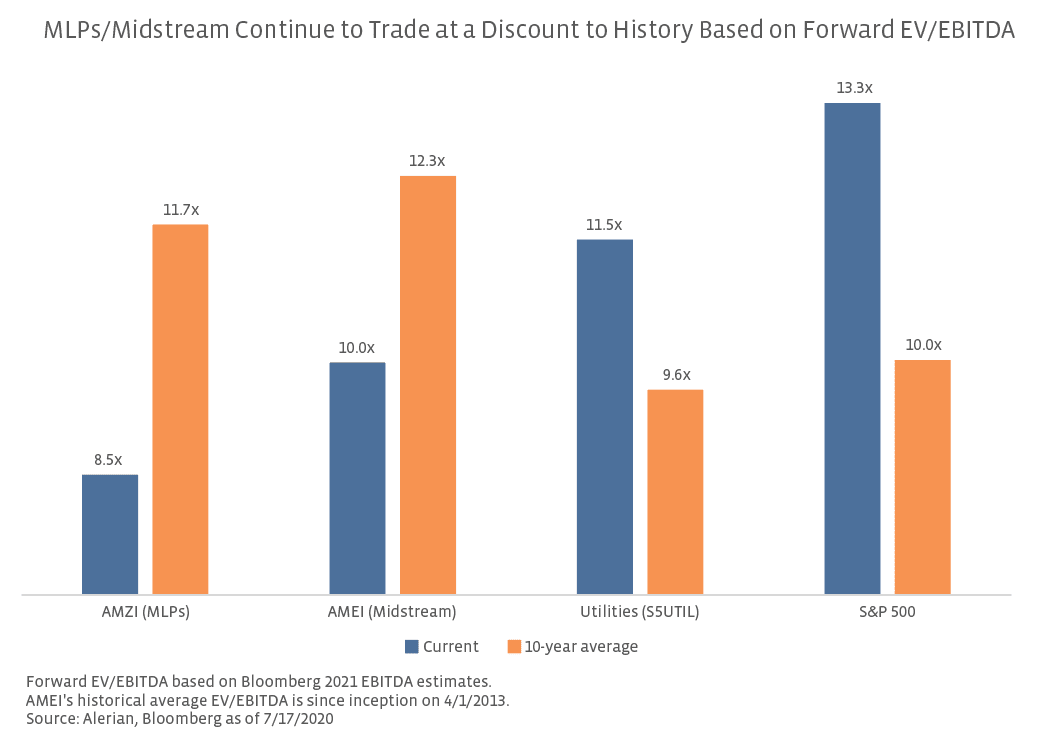
While premium valuations for utilities and discounts for midstream are nothing new (see valuation metrics from our April 2019 white paper here), recent price action has widened these valuation gaps. The chart below shows current and historical forward EV/EBITDA multiples for midstream and MLPs, utilities, and the S&P 500. Midstream continues to trade well below historical EV/EBITDA averages, while both utilities and the S&P 500 trade at premiums. AMEI also notably continues to trade at a discount to lows of 10.4x set near the end of the 2014-16 oil price collapse (read more).

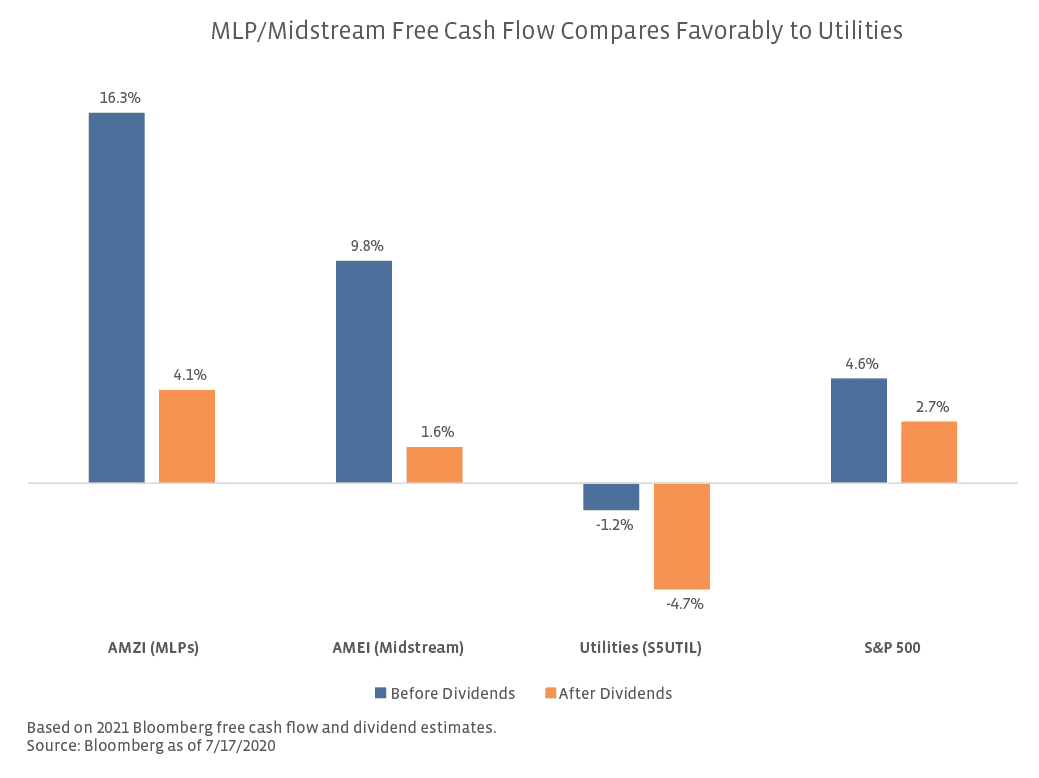
As free cash flow generation after dividends becomes more common among energy infrastructure companies, free cash flow yield can also be helpful in framing midstream’s value (read more). As seen in the chart below, free cash flow yields for the AMZI and AMEI are well above the negative free cash flow yields of utilities based on forecasted 2021 free cash flow before dividends. The free cash flow yield for the AMZI Index both before and after distributions is greater than that of the S&P 500, reflecting the dual benefit of relatively stable cash flows and declining growth capital spending. With capital spending having peaked in 2018/19 (read more), the stage was set for increasing free cash flow generation in midstream, and macro headwinds have spurred further spending reductions. In the current environment, excess cash flow in midstream will likely be used for balance sheet improvements, but in a more stable environment, there is the potential for returns of capital to shareholders as buybacks or dividend hikes. By contrast, several utility companies are continuing to deploy significant amounts of capital, particularly on renewable power generation. As an example, NextEra Energy (NEE), the largest utility company in the US by market capitalization, is guiding to $12-14 billion of annual capex at the midpoint through 2022, a significant portion of which will be devoted to renewable energy. This is consistent with 2018 and 2019 capital spending, but many midstream companies are guiding to steep year-over-year reductions in spending this year. These large capital outlays will result in delayed free cash flow generation for some utility companies.

Bottom Line
Energy infrastructure and utilities occupy a similar income-focused lane with investors, but there are several notable characteristics that differentiate the two industries. While utilities have outperformed so far in 2020 due to the volatility in energy markets, investors who are expecting further oil price and economic recovery and seeking high income, diversification, and value should continue to consider an allocation to midstream.

