

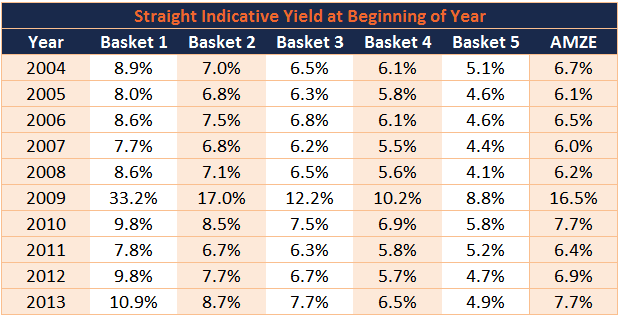
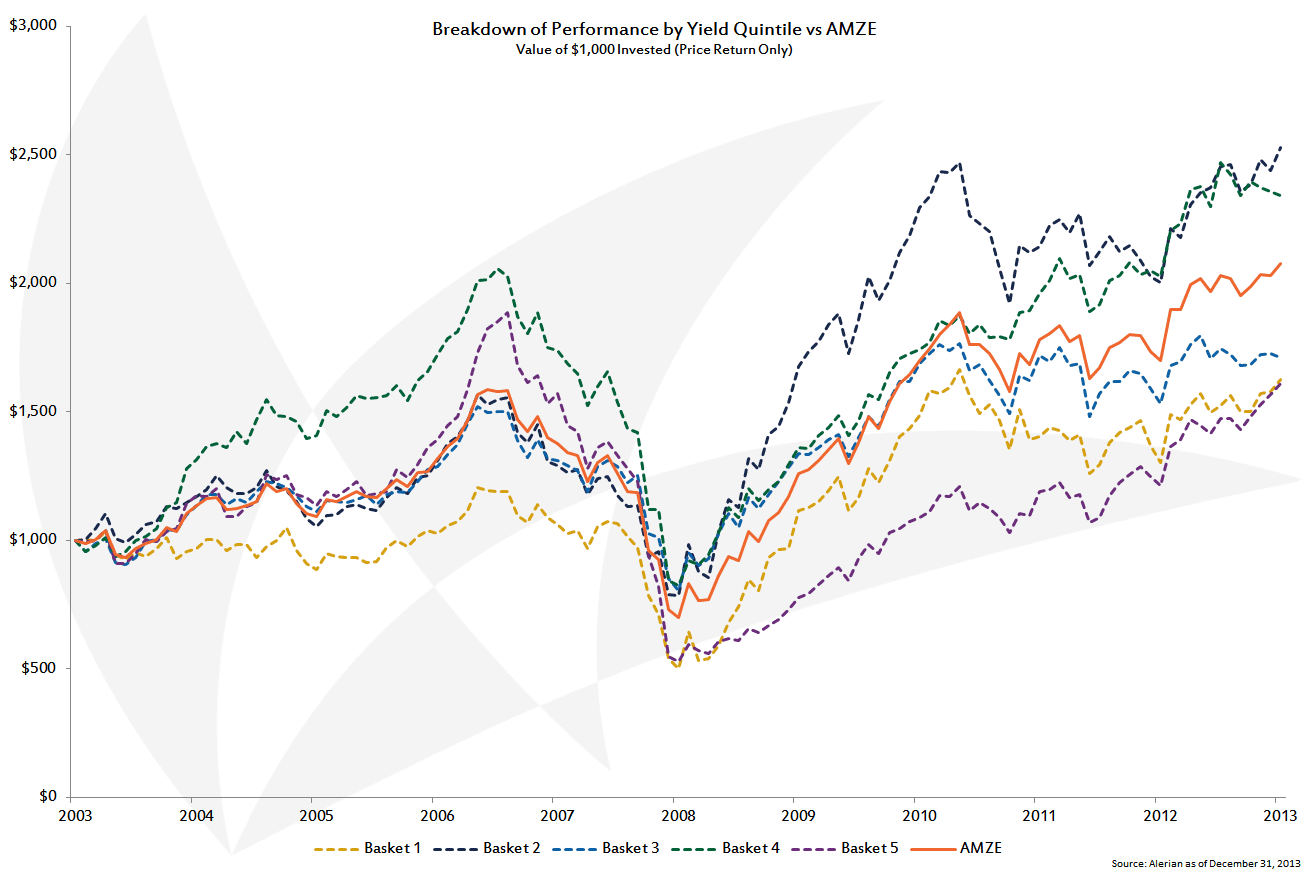
Basket 1 includes the names with the ten highest yields. Basket 5 has the names with the ten lowest yields. The ten years of historical performance, inclusive of 2004-2013, are then analyzed for price return. Note that the aggregate performance of the baskets may not line up exactly with the performance of the AMZE, since the baskets are rebalanced annually instead of quarterly.

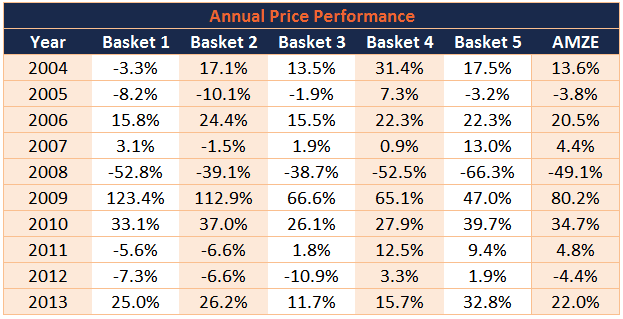
The highest-yielding names are considered to be the riskiest, and that appears to be rewarded, especially during the volatile years of the financial crisis and subsequent recovery. In 2008, Basket 1 fell only a few percentage points more than the index; however, in 2009, during the recovery, it had the highest return: 123%, compared to the AMZE’s increase of 80%.

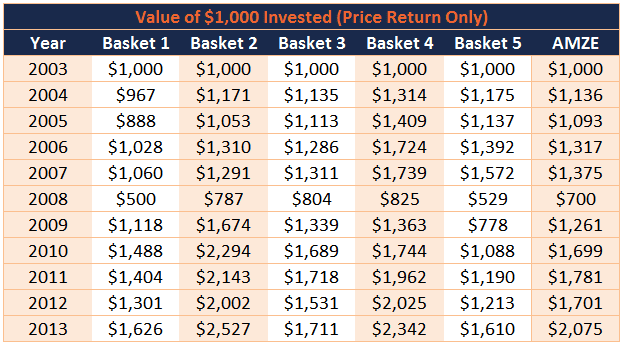
During the 2008-2009 period, Baskets 1, 2, and 3 regained all of their losses and then some. Baskets 4 and 5, on the other hand, remained down over 20% and 50%, respectively. During volatile times, it appears that the “safest” MLPs, focusing solely on price performance, may not actually provide much safety at all.
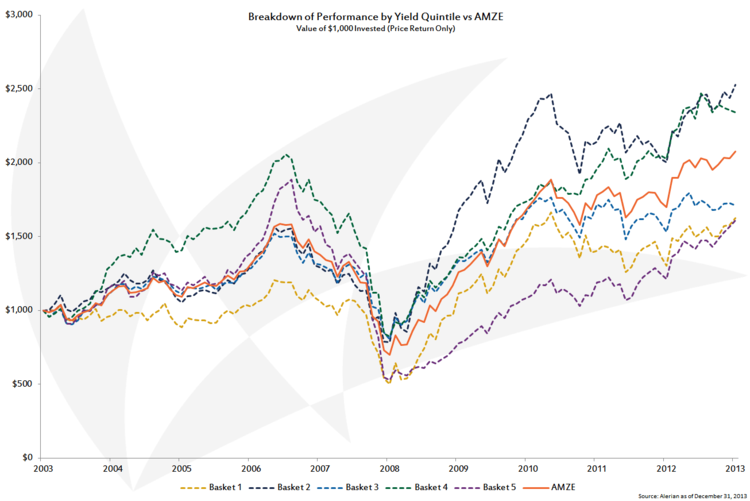
In a price return comparison against the five baskets, the AMZE falls in the middle, as is to be expected. Perhaps less intuitive is that the best performer over the period is Basket 2. In the next part of this series, we’ll examine the performance of each quintile and take a closer look at volatility. Stay tuned!

