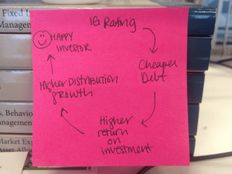

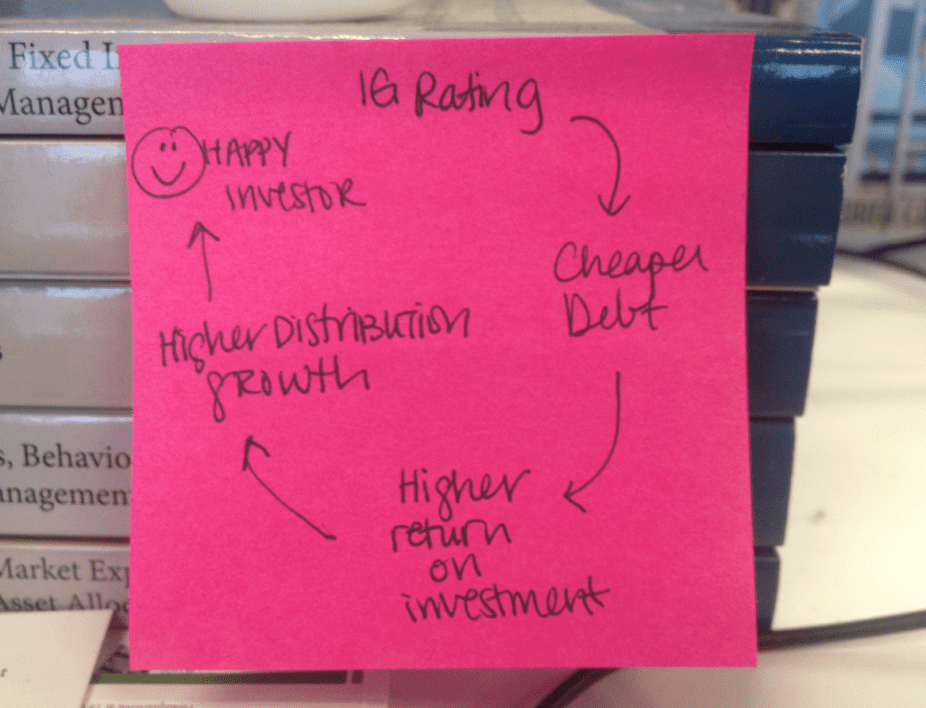
The higher a company’s credit rating is, the lower the interest rate on its debt will be. As the rating increases, particularly once it reaches investment grade, the more certain the purchasers of the debt are of repayment and the lower the rate of return they require for taking on risk. Regardless of whether an investor purchases the company’s debt or equity, it’s an investment in the same company. So, if a bondholder is confident in repayment, an equity investor is considered to be relatively safe as well.
The higher an MLP’s credit rating, the cheaper its debt will be. When an MLP has cheaper debt, its cost of capital is lower, so less of the profits from a particular project go toward interest payments to bondholders. If less money is paid to bondholders, more money is available to be paid to equity holders in the form of distribution increases. The one thing that MLP equity investors like more than a stable distribution is a growing distribution.
Rating agencies evaluate the elements of an MLP that are the most important to debt investors, which may not be the same metrics that are important to equity investors. Of the three major agencies, only Moody’s publishes both its ratings system and its reports free of charge. Since transparency is a core Alerian value, I’ll use Moody’s for my examples. The Moody’s rating is determined by:
Scale (30%). Scale measures the size and diversity of a company. In general, a larger company will be more broadly diversified, and greater diversification—either geographic or along the energy value chain—can reduce volatility, which can lower risk. Moody’s uses net Property, Plant & Equipment (PP&E) and EBITDA to measure Scale. Moody’s believes that for midstream energy companies, PP&E, as a measure of hard assets, is a better determinant of long-term debt coverage than total assets.
For an equity investor looking for broad exposure across multiple basins, Scale would be a good metric; however, for those investors interested in a particular segment of the value chain, Scale may be less relevant.
-
Business Risk (30%). Business Risk measures not only where a company is on the value chain, but its level of risk within that position. Compared to other companies, midstream energy firms have historically had lower business risk due to “operating stable and long-lived assets that have low reinvestment needs.” However, some midstream businesses are expanding into business lines that involve additional commodity risk and volume risk. Moody’s analysts measure a company’s Business Risk on a spectrum as depicted below. The evaluation is done on a forward-looking basis, emphasizing pro forma expectations over historical numbers.
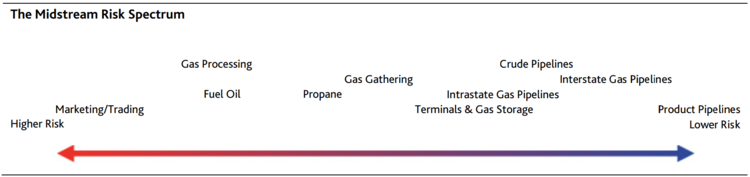
Source: Moody’s
Judicious investments at various points along the energy value chain, throughout various market cycles, can prove quite profitable for some MLP investors. But Business Risk isn’t an assessment of how to maximize investor profitability. Rather, it is intended to measure the degree to which a business requires ongoing capex and generates recurring revenue.
Financial Leverage and Distribution (40%). Financial Leverage & Distribution Profile measures how well a company would navigate a period of industry weakness, how much additional debt it may take on, and how flexible its balance sheet is. This is especially important with MLPs as they distribute nearly all available cash flow each quarter and generally must return to the capital markets to finance growth. Moody’s focuses on three quantitative ratios:
- Interest Coverage (EBITDA / Interest)
- Leverage (Debt / EBITDA)
- Distribution Coverage (Funds Flow from Operations – Maintenance Capex) / Distributions)
If you’re an MLP investor seeking distribution growth, take a look at the chart below. Moody’s seems to be exceptionally conservative with regard to both Leverage and Distribution Coverage. Show me an MLP with a 5x coverage ratio, and I’ll show you an investor base howling for a distribution increase. In other words, don’t expect Moody’s to assign an A rating to an MLP anytime soon.
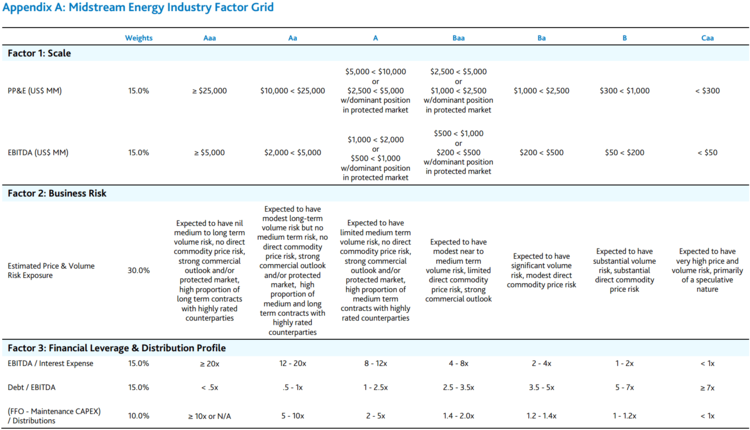
Source: Moody’s
The combination of these three metrics does not exclusively determine a company’s final rating. Moody’s also accounts for regulatory and litigation risk, management strategy, and confidential information. Additionally, the percent weighting scheme may also vary according to a company’s specifics. Moody’s will also consider an MLP individually, or in concert with its family of companies.
This subjectivity and flexibility can be useful when applied judiciously. However, since bondholders are senior to equity investors in the case of a challenging environment or even bankruptcy, an equity investor could find her distribution in trouble long before a bondholder needs to worry about the security of her coupon.
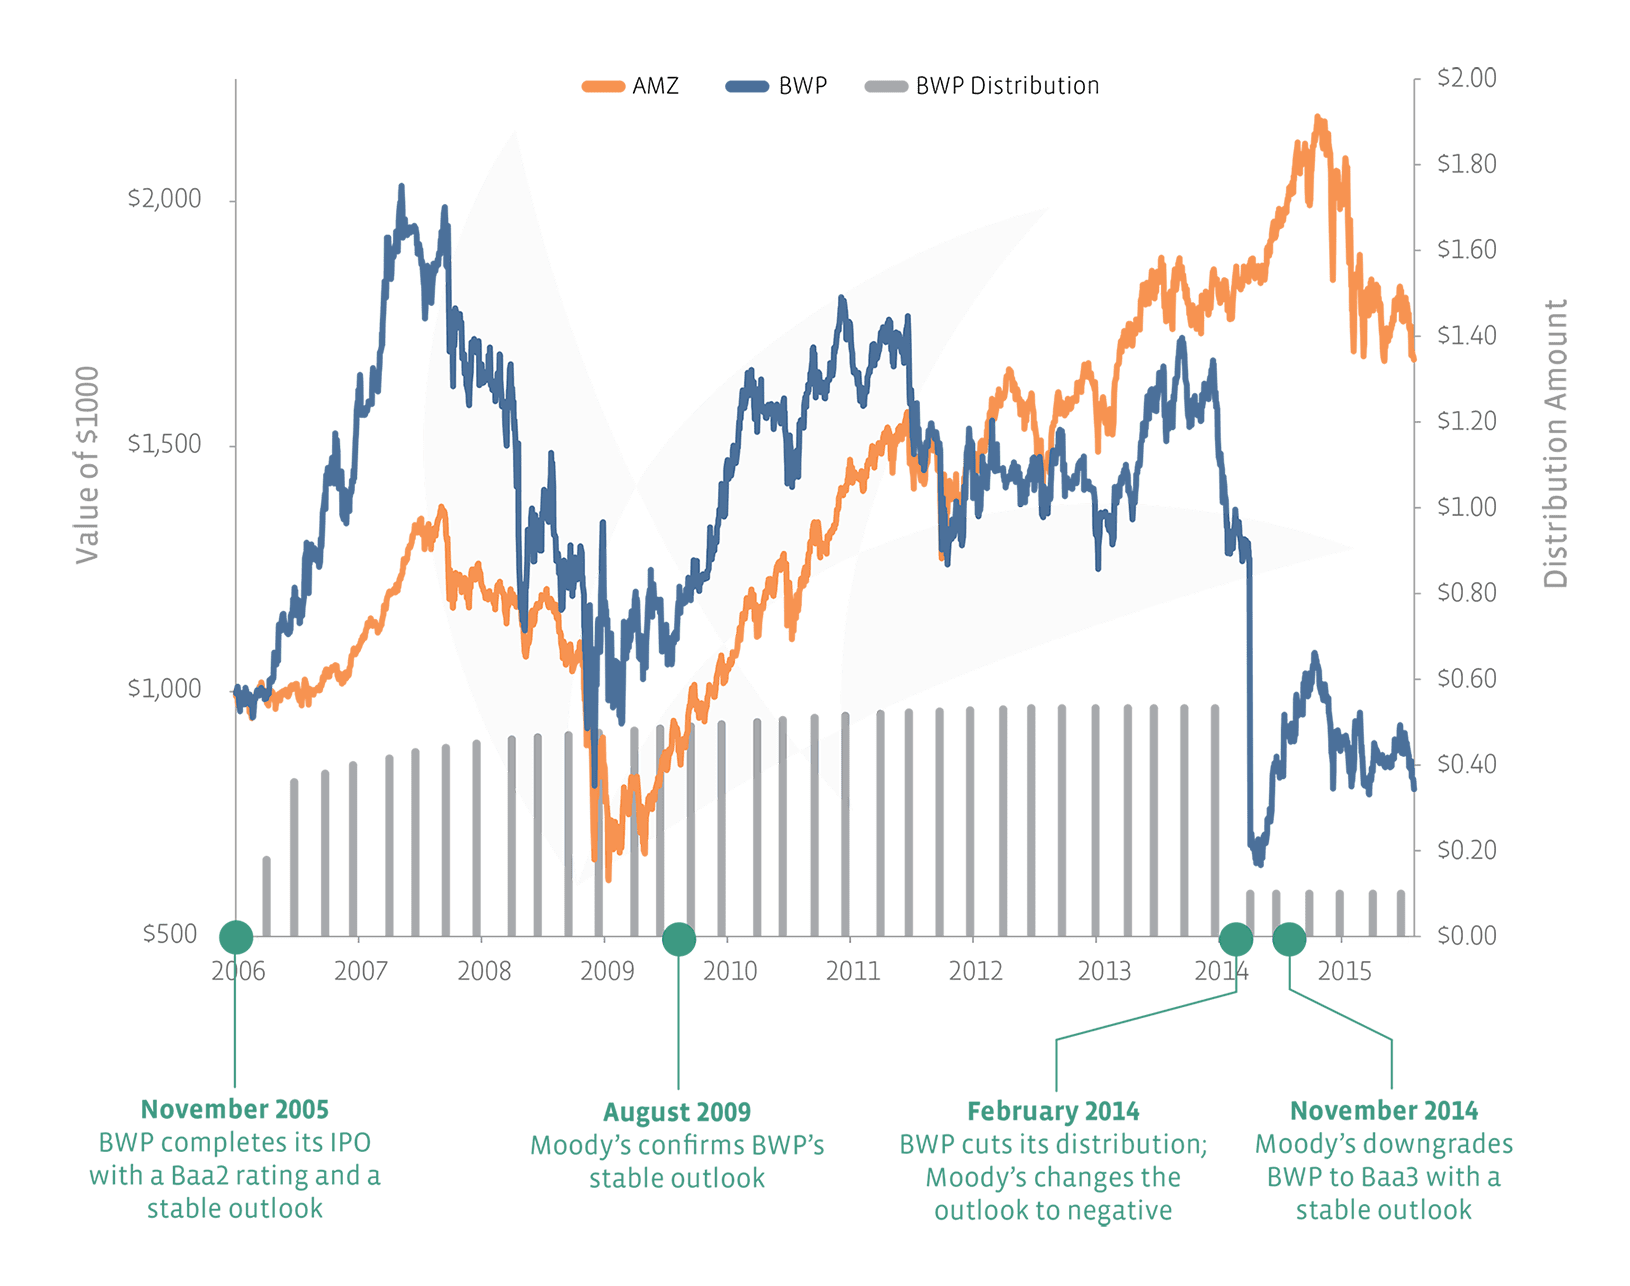
For the equity investor, investment grade ratings aren’t always a short cut to stability. In 2009, Moody’s reaffirmed its stable outlook and Baa2 rating on Boardwalk Pipeline Partners (BWP) after anomalous second quarter results. A rating of Baa2 is not only investment grade, but one notch above the bare minimum investment grade rating of Baa3. In 2011, there were two reports, one indicating that low natural gas prices would pose little trouble for Midwest natural gas companies, and the other indicating that BWP’s expansion plans could put negative pressure on the rating over time.
On February 10, 2014, BWP cut its distribution from $0.5325 to $0.10. That same day, Moody’s downgraded its outlook for the company from stable to negative. It wasn’t until November 2014 that Moody’s downgraded BWP to Baa3, which is still investment grade. Paradoxically, this is quite reasonable. BWP cut its distribution much more than necessary. With a $0.10 distribution, BWP is able to maintain a 4.0x Distribution Coverage ratio (which is at the high end of the range for an A rating), and a 4.0x Leverage ratio (which is in the middle of the range for a Ba rating). In short, an investor in BWP equity relying on Moody’s ratings likely got quite the unpleasant surprise last year.
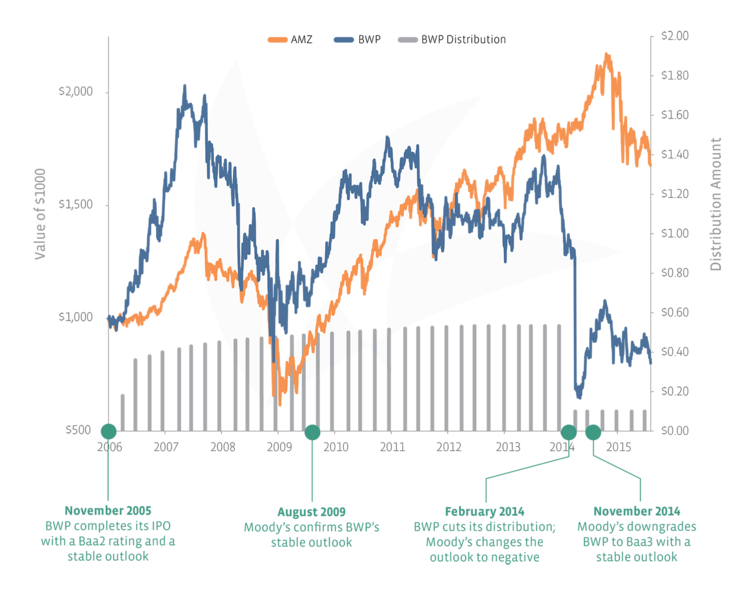
Source: Alerian
So be careful out there. A good credit rating may imply that your bond coupon is safe, but it does not necessarily imply that your distribution is safe.
In part 2, we’ll discuss how rating agencies may be too lenient on leverage and commodity price exposure, while being surprisingly skeptical of high coverage ratios and distribution increases.

