ETFdb Logo
  • ETF Database
  • Content Hubs
    • Themes
      • Active ETF
      • Alternatives
      • Artificial Intelligence
      • China Insights
      • Core Strategies
      • Crypto
      • Disruptive Technology
      • Energy Infrastructure
      • ETF Building Blocks
      • ETF Investing
      • ETF Strategist
      • Financial Literacy
      • Fixed Income
      • Free Cash Flow
      • Future ETFs
      • Innovative ETFs
      • Institutional Income Strategies
      • Leveraged & Inverse
      • Market Insights
      • Market Outlooks
      • Modern Alpha
      • Nuclear Energy
      • Portfolio Strategies
      • Sector Investing
      • Tax Efficient Income
      • Thematic Investing
    • Asset Class
      • Equity
        • U.S. Equity
        • Int'l Developed
        • Emerging Market Equities
      • Alternatives
        • Gold/Silver/Critical Materials
        • Cryptocurrency
        • Currency
        • Volatility
      • Fixed Income
        • Investment Grade Corporates
        • US Treasuries & TIPS
        • High Yield Corporates
        • Int'l Fixed Income
    • ETF Ecosystem
    • ETFs in Canada
    • Market Outlook
    • Crypto ETF Hub
  • Tools
    • ETF Screener
    • ETF Country Exposure Tool
    • ETF Database Categories
    • Indexes
    • Scenario Analysis
    • Watchlists
    • Head-To-Head ETF Comparison Tool
    • Mutual Fund To ETF Converter
    • ETF Stock Exposure Tool
    • ETF Issuer Fund Flows
  • Research
    • ETF Education
    • Equity Investing
    • Dividend ETFs
    • Leveraged ETFs
    • Inverse ETFs
    • Index Education
    • Index Insights
    • Top ETF Sectors
    • Top ETF Issuers
    • Top ETF Industries
  • Webcasts
  • Sectors
    • Sector Investing Content Hub
    • XLK
    • XLI
    • XLU
    • XLY
    • XLP
    • XLRE
    • Sector Power Rankings
    • XLE
    • XLC
    • XLF
    • XLV
    • XLB
  • Multimedia
    • ETF 360 Video Series
    • ETF of the Week Podcast
    • Gaining Perspective Podcast
    • ETF Prime Podcast
    • Video
  • Company
    • About VettaFi
  • PRO
    • Pro Content
    • Pro Tools
    • Advanced
    • FAQ
    • Free sign up
    • Login
  1. Index Insights
  2. The Ripple Effects of COVID-19 on Natural Gas Power Generation
Index Insights
Share

The Ripple Effects of COVID-19 on Natural Gas Power Generation

Bryce BinghamApr 26, 2020
2020-04-26

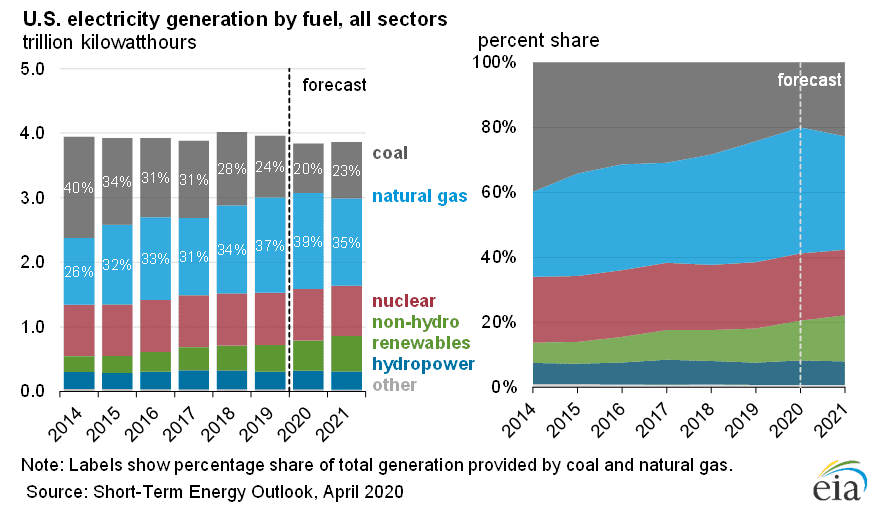
Crude inventories, prices, and production have undoubtedly been front of mind for many energy investors, but the impact of COVID-19 is far-reaching across energy. With the vast majority of Americans under shelter-in-place orders and many businesses closed until further notice, the demand for electricity generation is decreasing. Following a 1.4% decline in 2019, the US Energy Information Administration (EIA) is forecasting that annual US electric power sector generation will decline by 3% in 2020, falling below four billion megawatt-hours for the first time in over a decade. However, not all power sources will feel this demand destruction equally. The brunt of the decline is expected to be absorbed by coal given its declining production and unfavorable emissions profile. Natural gas and renewables, however, will likely emerge relatively unscathed, if not stronger. The EIA’s Short Term Energy Outlook projections show an annual decline of 20% for coal power generation this year compared to a 1% increase in natural gas generation. Through March 18, year-to-date natural gas generation was up 12% on an annual basis despite a 5% year-over-year decline in total electricity generation, demonstrating the impact that dramatically lower Henry Hub prices, new capacity additions, and perhaps some coal-to-gas switching have already had on the power generation landscape in 2020. Renewables are expected to be the fastest growing electricity source this year given lower operating costs but are not totally insulated from the impact of COVID-19, particularly in regard to new capacity. The EIA is forecasting an 11% increase in renewable generation from the electric power sector this year, but the most recent projections for new wind and solar capacity additions were lowered by 5% and 10% respectively. For context, the annual change in renewable generation represents a 73 billion kilowatt-hours (kwH) increase compared to a 17 billion kwH increase for natural gas, but renewables will still represent less than 20% of the total power mix, as seen in the charts below.

The shift in electricity generation away from coal in favor of natural gas has been ongoing for some time. As seen in the charts below, natural gas has grown from 26% of US electricity generation in 2014 to 37% last year, overtaking coal as the largest source of US electricity in the process. This transition has coincided with robust growth in natural gas production. From 2014 to 2019, dry natural gas production grew by 5.4% annually. Even with a projected decline in natural gas production this year, the EIA is still forecasting a gain in gas’s share of electricity generation from 37% to 39%. Coal’s market share is expected to decline to 20% in 2020 – half of what it was in 2014. Based on the EIA’s Hourly Electricity Grid Monitor, coal was behind nuclear energy in the power mix, representing a mere 14% of electricity generation on April 26. Natural gas still represented the largest portion at 35% on that day.

This is the image alt text

How will this shift in the electricity landscape impact midstream? Resilient demand for natural gas amid lower total electricity generation is a positive for energy infrastructure companies with gas-focused assets, particularly demand-pull pipelines with utility or power customers. Large, diversified natural gas pipeline operators can benefit from this demand-pull exposure even when production is stalling (read more). In its 1Q20 earnings presentation, Kinder Morgan (KMI) updated its natural gas growth backlog, the vast majority of which has a demand-pull component. While several unknowns still surround the impact of COVID-19 on power demand, preliminary data and EIA forecasts paint a constructive picture for natural gas and the midstream assets needed to meet gas-fired power demand.


Content continues below advertisement

» Popular Pages

  • Tickers
  • Articles

Jun 26

VFLO Marks 3 Years of Next-Gen Free Cash Flow Investing

Jun 26

S&P 500 Snapshot: Longest Losing Streak Since August

Jun 26

Treasury Yields Snapshot: June 26, 2026

Jun 26

Growth, Value ETFs QGRO & VALQ Update Their Holdings

Jun 26

Why Japan and Asia Are Rising on Global Radars With WisdomTree

Jun 26

Physical AI and Infrastructure: Why the Next Era of Innovation is Moving Beyond the Cloud

Jun 26

Midyear Symposium: Making a Strategic Home for Thematic ETFs

Jun 26

European Defense ETF: Maybe a Dip Worth Buying

Jun 26

From Tech Giants to MANGOS: A New ETF Trend Emerges

Jun 26

Leaving on Your Terms: Planning Your Exit

QQQ

Invesco QQQ Trust Series I

VOO

Vanguard S&P 500 ETF

GLD

SPDR Gold Shares

DRAM

Roundhill Memory ETF

SMH

VanEck Semiconductor ETF

PPLT

abrdn Physical Platinum...

SIVR

abrdn Physical Silver Shares...

SOXX

iShares Semiconductor ETF

SCHD

Schwab US Dividend Equity ETF...

SOXL

Direxion Daily Semiconductor...

Loading Articles...

Advertisement

Is Your Portfolio Positioned With Enough Global Exposure?

ETF Education Channel

How to Allocate Commodities in Portfolios

Tom LydonApr 26, 2022
2022-04-26

A long-running debate in asset allocation circles is how much of a portfolio an investor should...

Core Strategies Channel

Why ETFs Experience Limit Up/Down Protections

Karrie GordonMay 13, 2022
2022-05-13

In a digital age where information moves in milliseconds and millions of participants can transact...

}
X