ETFdb Logo
ETFdb Logo
  • ETF Database
  • Channels
    • Themes
      • Active ETF
      • Artificial Intelligence
      • Beyond Basic Beta
      • China Insights
      • Climate Insights
      • Core Strategies
      • Crypto
      • Direct Indexing
      • Disruptive Technology
      • Energy Infrastructure
      • ETF Building Blocks
      • ETF Investing
      • ETF Education
      • ETF Strategist
      • Financial Literacy
      • Fixed Income
      • Free Cash Flow
      • Innovative ETFs
      • Institutional Income Strategies
      • Leveraged & Inverse
      • Managed Futures
      • Market Insights
      • Modern Alpha
      • Multifactor
      • Responsible Investing
      • Retirement Income
      • Tax Efficient Income
    • Asset Class
      • Equity
        • U.S. Equity
        • Int'l Developed
        • Emerging Market Equities
      • Alternatives
        • Commodities
        • Gold/Silver/Critical Minerals
        • Currency
        • Volatility
      • Fixed Income
        • Investment Grade Corporates
        • US Treasuries & TIPS
        • High Yield Corporates
        • Int'l Fixed Income
    • ETF Ecosystem
    • ETFs in Canada
  • Tools
    • ETF Screener
    • ETF Country Exposure Tool
    • ETF Sector Tracker Tool
    • ETF Database Categories
    • Head-To-Head ETF Comparison Tool
    • ETF Stock Exposure Tool
    • ETF Issuer Fund Flows
    • Indexes
    • Mutual Fund To ETF Converter
  • Research
    • ETF Education
    • Equity Investing
    • Dividend ETFs
    • Leveraged ETFs
    • Inverse ETFs
    • Index Education
    • Index Insights
    • Top ETF Sectors
    • Top ETF Issuers
    • Top ETF Industries
  • Webcasts
  • Themes
    • AI ETFs
    • Blockchain ETFs
    • See all Thematic Investing ETF themes
    • ESG Investing
    • Marijuana ETFs
  • Multimedia
    • ETF 360 Video Series
    • ETF of the Week Podcast
    • ETF Prime Podcast
    • Video
  • Company
    • About VettaFi
    • Get VettaFi’ed
  • PRO
    • Pro Content
    • Pro Tools
    • Advanced
    • FAQ
    • Pricing
    • Free Sign Up
    • Login
  1. Index Insights
  2. The Shortcomings of MLP Valuation Shortcuts (and the Work Necessary to Find Real Value)
Index Insights
Share

The Shortcomings of MLP Valuation Shortcuts (and the Work Necessary to Find Real Value)

Maria HalmoMar 09, 2016
2016-03-09

When it comes to valuing midstream MLPs, many valuation lessons have already been learned. Investors who are experts in other asset classes try to use Price/Earnings (P/E) ratios, but they include accelerated depreciation (a pure accounting value practically irrelevant to the ongoing fundamental business), making such numbers nearly nonsensical for asset intensive businesses (including Utilities). Using Price/Distributable Cash Flow (P/DCF) is the MLP equivalent, although that fact is not well known outside this space. Since under normal market conditions, MLP yields are steady and predictable, using yield has a valuation metric has become unreasonably popular.

Why Using Yield Doesn’t Work
For years, it has been known that the most accurate way to value midstream MLPs is to use a P/DCF ratio, or Enterprise Value/EBITDA (EV/EBITDA). Still, if one made a number of assumptions that generally held true, it was possible to calculate valuations on the proverbial bar napkin.

The assumptions are as follows:
(1) an MLP pays out nearly all of its DCF each quarter in the form of distributions,
(2) incoming cash flows are stable and increase only when growth has taken place,
(3) external financing is readily available to fund projects, and
(4) unit prices reflect distribution changes and expectations.

If these are true, then the yield on a given MLP can be an accurate reflection of its value. Looking over the past 5-6 years, if these four assumptions held (and Treasuries stayed relatively stable), then the following heuristics were also generally accurate: A company with multi-year expected distribution growth in the double digits typically will have a yield less than five percent. Companies with flat distribution growth typically trade around eight percent under normal market conditions. Those companies expected to cut distributions will trade to double digit yields in the teens or higher.

An investor looking to use yield as a valuation metric might use a chart similar to the below. A ten-year median yield target is of course an arbitrary measure of fair value. Still, it is worth noting that despite what was said above about double-digit yields indicating investor belief in a forthcoming distribution cut, Enterprise Products Partners (EPD) has in fact raised its distribution each quarter for the past 55 quarters. Likewise, despite a yield below 4% in 2013, EPD’s distribution growth has been around 5%-8% over the past ten years, never in the double-digits. Yield is a valuation short-cut, but like all short-cuts, it has short-comings.

This is the image alt text

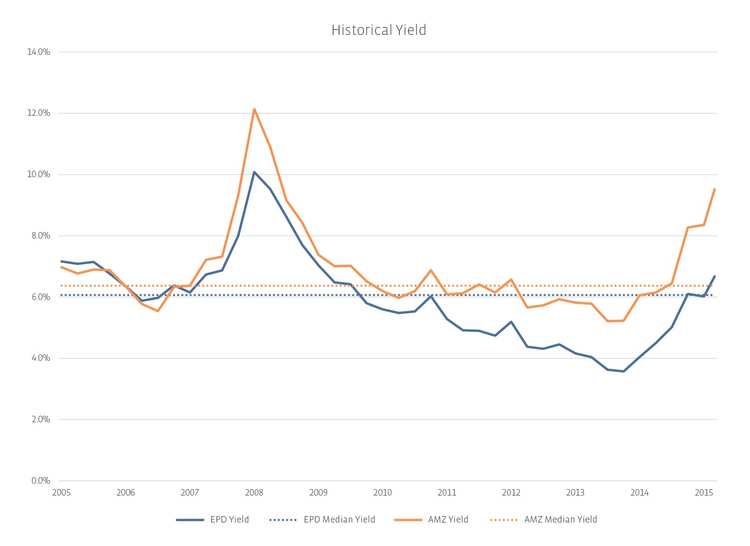
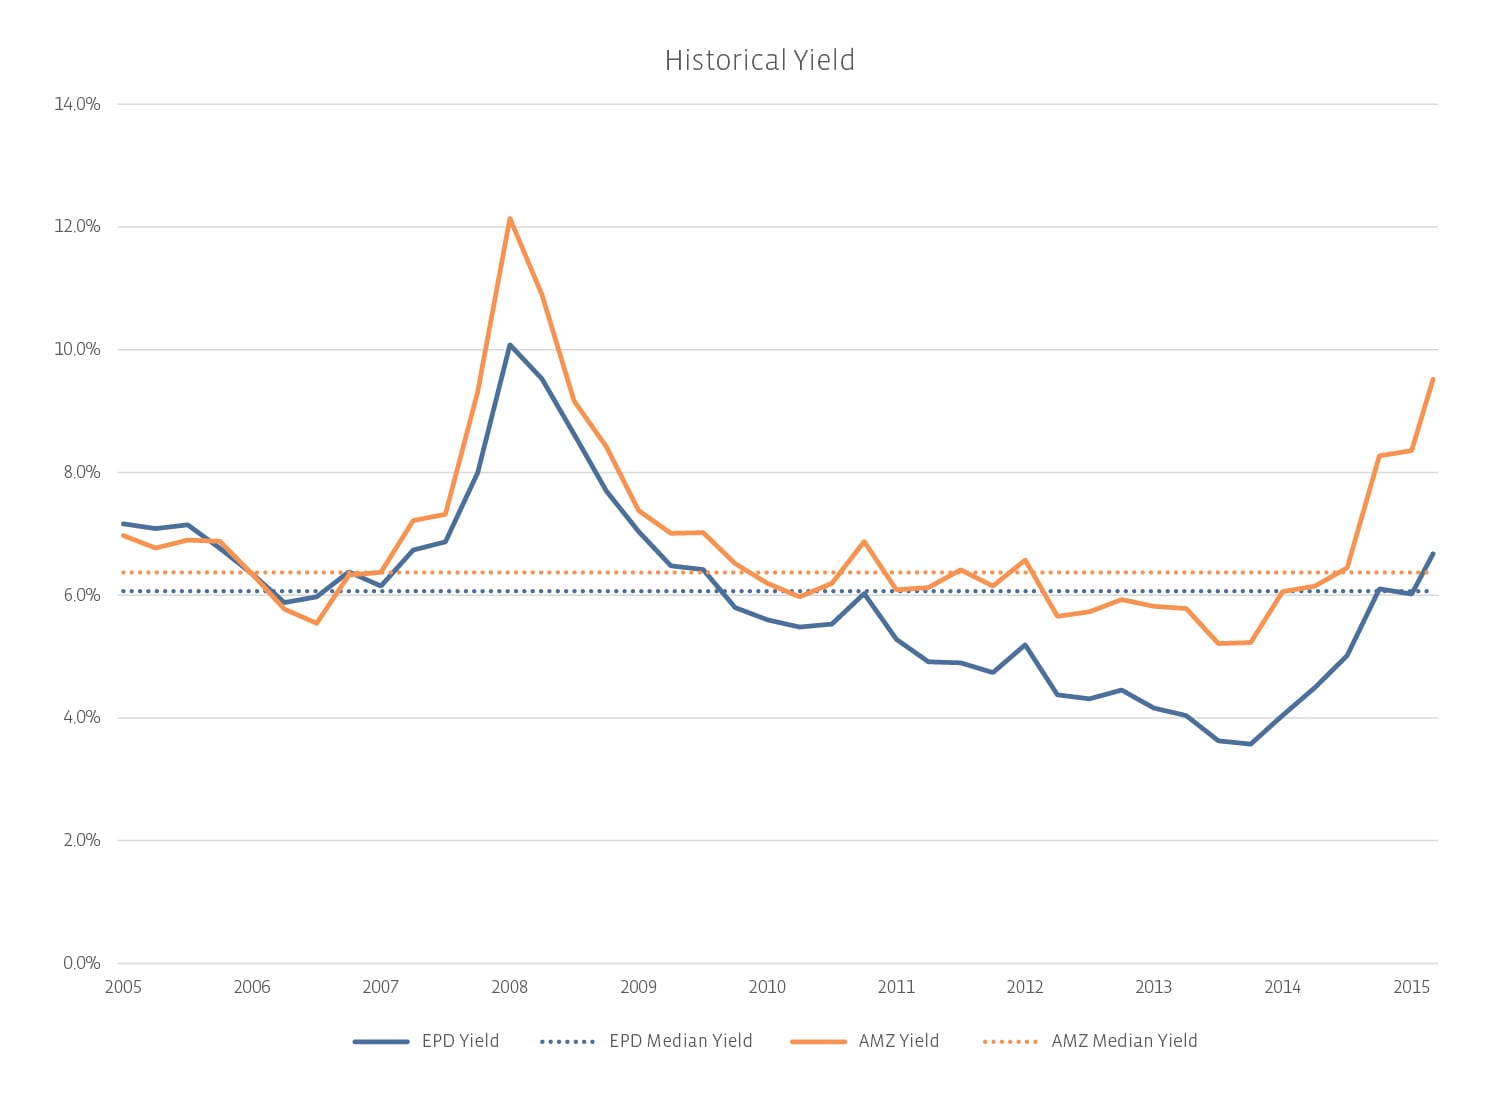
The short-comings of a yield as a valuation metric are even more prominent now that distribution cuts for midstream MLPs are within the realm of imagination (and, according to some analysts, not only possible, but probable and desirable). Cash that was previously paid out in the form of distributions is now being viewed as a potential financing source. Thus, any valuation metric that relies on the yield (which relies on the distribution) is useless.

How to Use P/DCF
To value a midstream MLP, investors will have to do some homework. Instead of simply measuring the cash distributed, investors will have to research how much cash is generated. For MLPs, the best metric to measure useable cash is Distributable Cash Flow (DCF) .  Unfortunately, Alerian has yet to find a data provider who reliably calculates DCF (understandable, since DCF is quite company-specific and difficult to automate unless a computer understands how to read footnotes in SEC filings).

A basic DCF calculation begins with net income, adds back depreciation and amortization, removes maintenance capex, and adjusts for any noncash items (such as deferred income tax) and nonrecurring items (such as proceeds from asset sales).

Once DCF has been calculated, a P/DCF ratio can be calculated and compared to the company’s own historical levels as well as to peers. By including the investor’s views as to the future of the MLP, DCF can be estimated on a forward basis. And then, viola, the investor can ascertain whether the MLP is trading above or below an appropriate P/DCF ratio.

Enterprise Products Partners as an Example
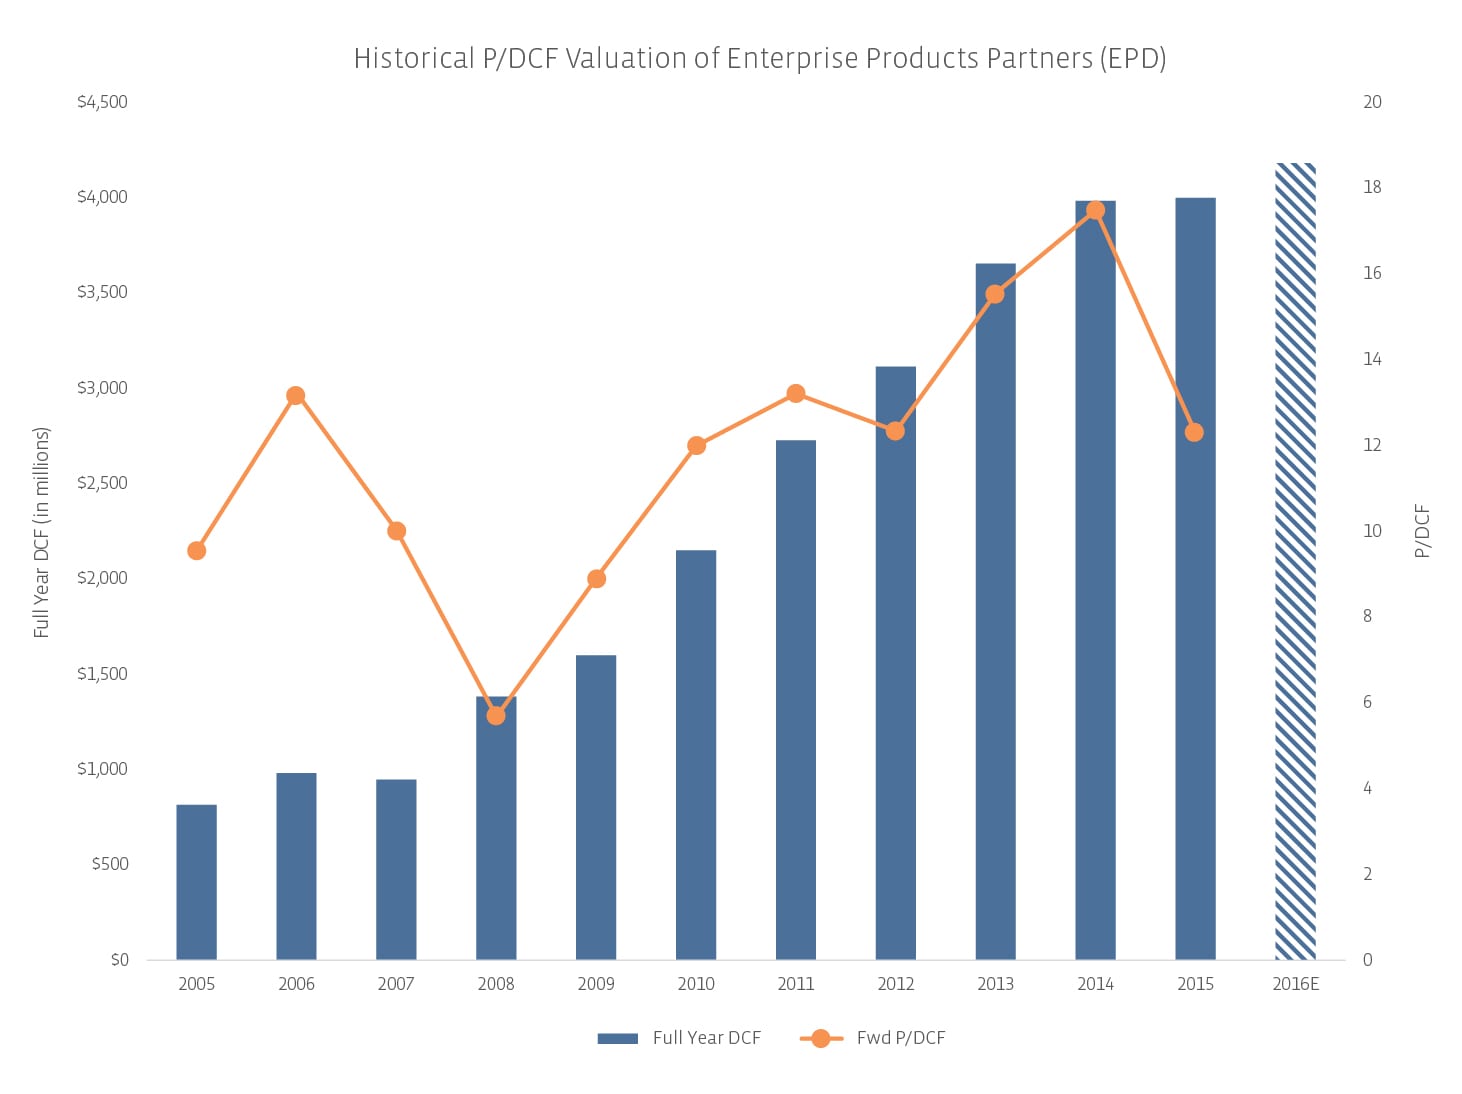
This is all easier said than done, of course. As an example, I calculated historical numbers for EPD. Earnings press releases provide all the numbers necessary to calculate ten years of historical DCF, and even include EPD’s own adjusted DCF number . Since EPD now provides distribution growth guidance, I was able to back into a projected DCF number for 2016 using an estimated coverage ratio of 1.3x .


Content continues below advertisement

This is the image alt text

P/DCF was calculated using the market cap on the last day of the year and the next year’s actual DCF value.

Given this projected 2016 DCF of around $4.2billion, what is an appropriate value for EPD? As I work for an indexing firm, it would be inappropriate for me to suggest a “correct” answer to that question, because it depends on the multiple you use.

Over the years, Enterprise’s P/DCF multiples have ranged from 5x-17×. In determining which P/DCF multiple to use, it comes down to risk-adjusting expected returns. Consider business model risk: businesses with more commodity exposure suggest a lower multiple. So, a small cap G&P MLP with single basin exposure should have a lower P/DCF than a large, interstate natural gas pipeline company. In other words, an investor is willing to pay a premium (higher) multiple for less commodity-sensitive or diversified cash flows. Beyond that, consider a company’s leverage: how much debt has it taken on and can it afford those payments? Does it have a supportive general partner, affordable access to capital, and backlog of visible growth via drop-down assets?

Who Should Use P/DCF
Calculating DCF and determining an appropriate multiple are a lot of work. Technical traders have their own bewildering array of algorithms, but it is those patient investors looking for value within the sector who will find the most utility in P/DCF calculations. All the same, I hope this example has given you not only an idea of a reasonable trading range for EPD, but also how to calculate these numbers for other energy infrastructure companies. It is a lot of work, I’ll grant you. But if something is worth doing, it’s worth doing right.


Edited to fix and clarify that P/DCF is market cap/DCF, not unit price/DCF.

» Popular Pages

  • Tickers
  • Articles

Sep 29

A Fixed Income Primer for Constructing Portfolios

Sep 29

Main Management Market Note: September 29, 2023

Sep 29

Higher for Much Longer?

Sep 29

Moving Averages: S&P Ends September Down 4.9%

Sep 29

This Week in ETFs: FormulaFolios Renamed & Adds New Funds

Sep 29

Play Online Car Sales News in These 2 China ETFs

Sep 29

SEC Opens Ethereum Futures ETF Floodgates

Sep 29

VettaFi Voices On: Managing Risk in an Uncertain Economy

Sep 29

SPYI Outperforms SPY in Challenging 3rd Quarter

Sep 29

More Rate Hikes? Watch Treasury ETF USFR

QQQ

Invesco QQQ Trust Series I

SPY

SPDR S&P 500 ETF Trust

VOO

Vanguard S&P 500 ETF

JEPI

JPMorgan Equity Premium...

TLT

iShares 20+ Year Treasury...

SCHD

Schwab US Dividend Equity ETF...

SMH

VanEck Semiconductor ETF

VGT

Vanguard Information...

VTI

Vanguard Total Stock Market...

XLK

Technology Select Sector SPDR...

Loading Articles...
Our Sites
  • VettaFi
  • Advisor Perspectives
  • ETF Trends
Tools
  • ETF Screener
  • Mutual Fund to ETF Converter
  • Head-To-Head ETF Comparison
  • ETF Country Exposure Tool
  • ETF Stock Exposure Tool
  • ETF Database Pro
More Tools
  • Financial Advisor & RIA Center
Explore ETFs
  • ETF News
  • ETF Category Reports
  • Premium Articles
  • Alphabetical Listing of ETFs
  • Browse ETFs by ETF Database Category
  • Browse ETFs by Index
  • Browse ETFs by Issuer
  • Compare ETFs
Information
  • Contact Us
  • Terms of Use and Privacy Policy
  • © 2023 VettaFi LLC. All rights reserved.

Advertisement

Is Your Portfolio Positioned With Enough Global Exposure?

ETF Education Channel

How to Allocate Commodities in Portfolios

Tom LydonApr 26, 2022
2022-04-26

A long-running debate in asset allocation circles is how much of a portfolio an investor should...

Core Strategies Channel

Why ETFs Experience Limit Up/Down Protections

Karrie GordonMay 13, 2022
2022-05-13

In a digital age where information moves in milliseconds and millions of participants can transact...

}
X