
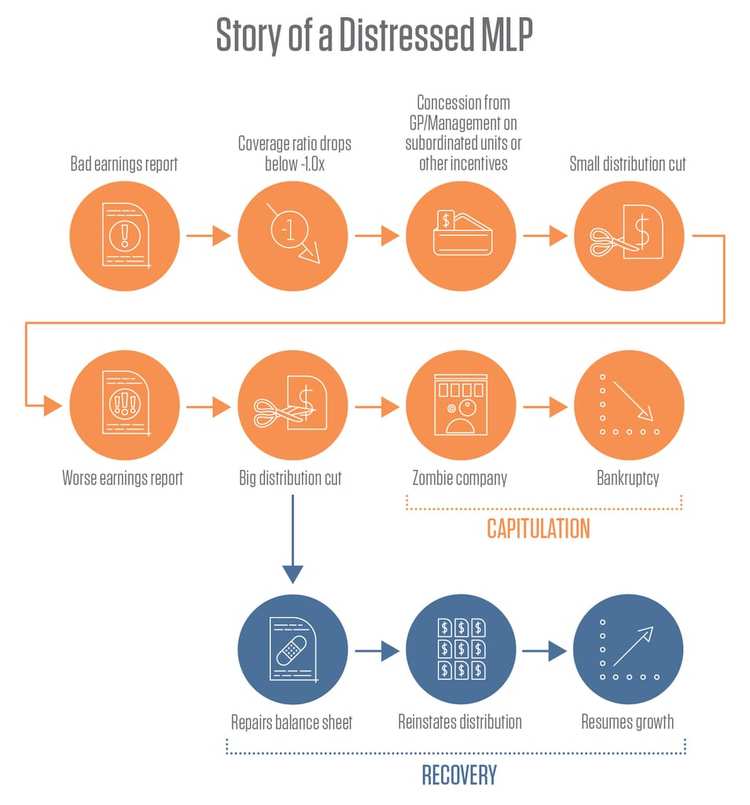
There are some exceptions to the rule. Most notably EnLink Midstream Partners (ENLK), formerly known as Crosstex Energy Partners (XTEX), cut its distribution multiple times during the height of the financial crisis in 2008 as it became clear that its balance sheet was being stretched too thin. Over three quarters, the partnership reduced its distributions from a peak of $0.63/quarter down to $0.50/quarter, then $0.25/quarter, and finally to nothing. During this period, its equity price dropped from $26.18 on the day of its last distribution increase announcement down to $1.68 on the day it cut its distribution to zero; a dramatic 94% drop over those three quarters. After six quarters of not paying out any distribution, they were able to reinstitute it at $0.25/quarter in 2010. The road to recovery was long and arduous for them, but they pulled it off by aggressively renegotiating contracts and selling assets. No doubt luck was a factor, as they held out just long enough for commodity markets to turn around.
The Changing Times
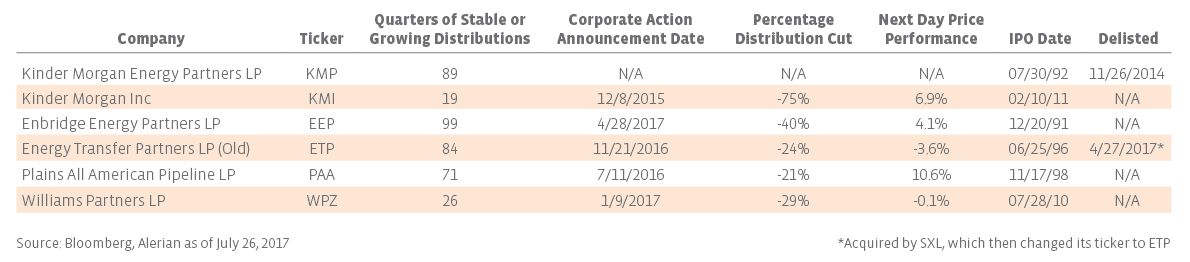
However, in recent years, distribution cuts have been perceived differently. One of the first energy infrastructure companies to cut distributions, yet be rewarded for their actions, was Kinder Morgan (KMI). Its predecessor, Kinder Morgan Energy Partners LP (KMP), held its distribution sacrosanct, never cutting throughout its 22 years of existence. While KMI is technically no longer an MLP, its underlying businesses and cash flows are still very MLP-like. On December 8, 2015, Kinder Morgan announced a 75% cut to its dividends, down to $0.125/share from its previous quarterly level of $0.51/share. Prior to 2015, the idea that one of the largest energy infrastructure companies in the US would cut its distribution so drastically was almost unthinkable. However, given the uncertainty in commodity prices at the time, the market reacted positively to this defensive move. The very next day, KMI shares rose 7% on the news, setting a precedent for large cap companies choosing to cut distributions within the energy infrastructure industry. Since then, it has become clearer that energy infrastructure investors are more defensive in their nature, valuing cash flow and balance sheet stability over distribution growth.
The Bandwagon Effect
Lately, we’ve seen several MLPs follow in Kinder’s footsteps. These are well-established, large-cap MLPs that have consistently paid stable or growing distributions since their IPO. Usually the cuts aren’t just straight cuts, but include some sort of simplification, acquisition, or other financial engineering attached to the action as well. Most notably, Plains All American (PAA) announced an agreement with their GP, Plains GP Holdings (PAGP), to simplify their ownership structure and eliminate their incentive distribution rights (IDRs) in conjunction with a 21% distribution cut at the LP level. Williams Partners (WPZ) also did a similar transaction, lowering its distribution by 29%, while simultaneously getting rid of its IDRs and issuing equity to its parent company, Williams Companies (WMB). Enbridge Energy Partners (EEP) also completed a strategic review and its board recommended a 40% distribution cut.
Most recently, Energy Transfer Partners (ETP) and Sunoco Logistics Partners (SXL) did a little dance and pulled off an interesting switcharoo. Technically SXL acquired ETP, but upon closing of the merger, SXL changed its name to Energy Transfer Partners and ticker to “ETP”. That quarter, they technically raised their distribution, from $0.52 to $0.535. However, if you originally owned ETP equity before the merger, your post-merger distribution payout decreased. While it wasn’t obviously called a “distribution cut”, functionally it had the same effect. Old ETP unitholders received 1.5 units of the new ETP entity, and while they were previously receiving $1.055/unit quarterly, post-merger they were only getting an adjusted equivalent of $0.8025/unit, effectively a 24% cut.
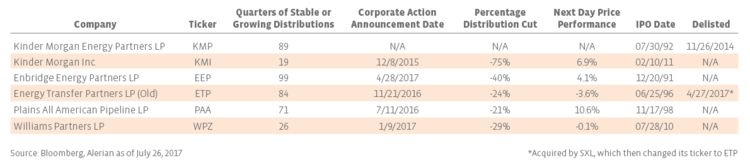
The real story, however, is how well the equity prices of these companies have held up. Looking at the chart above, three MLPs were significantly rewarded by the market the day after announcing distribution cuts, while one essentially stayed flat. The only MLP that saw an immediate dip in price was ETP, which was a special case because the distribution cut was obfuscated and wrapped up in the SXL merger announcement.
The Future of MLPs
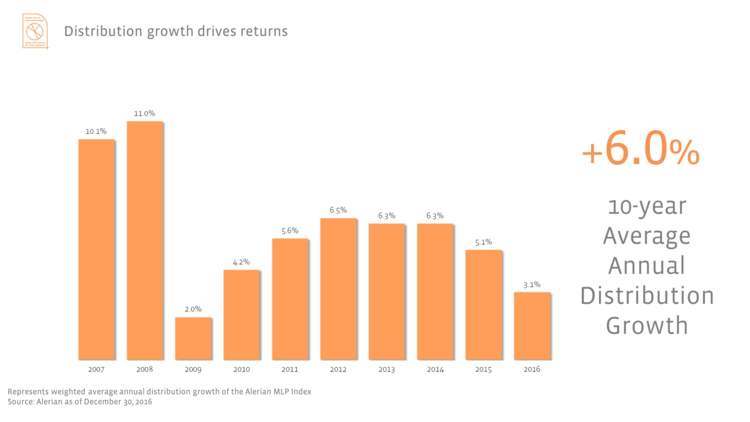
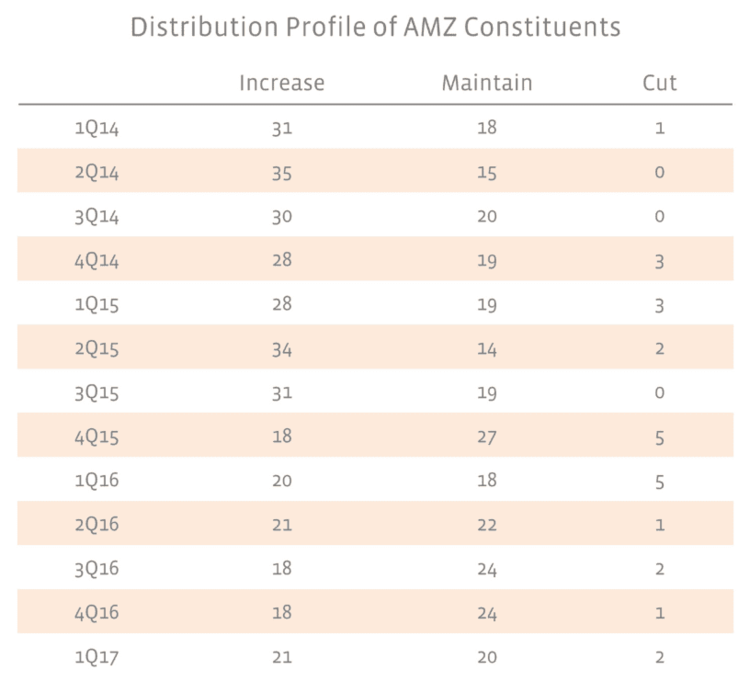
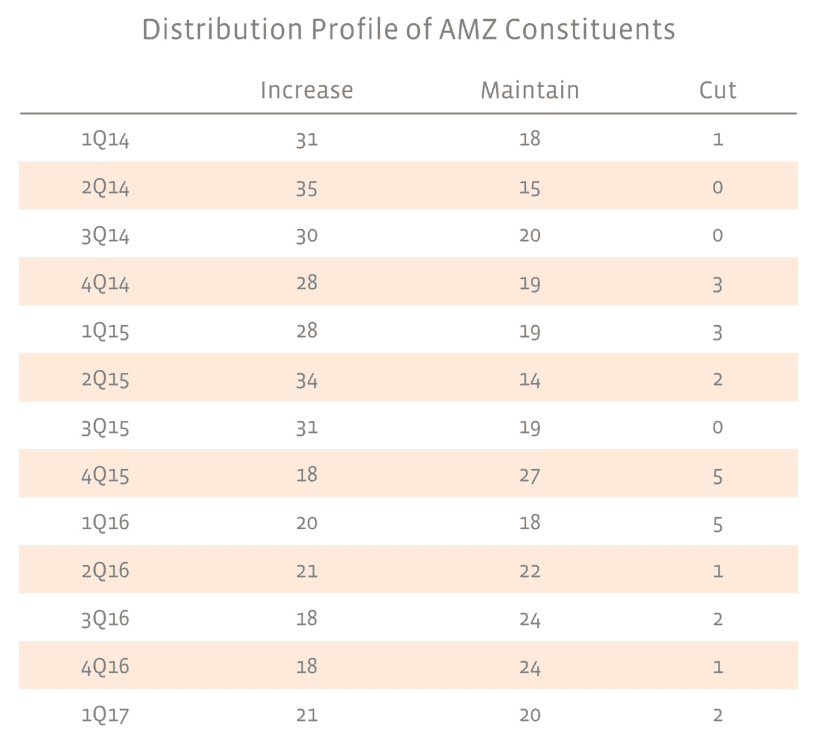
With the handful of large-cap, blue-chip MLPs cutting their distributions, distribution growth metrics for the sector have taken a hit. This isn’t necessarily a good thing or a bad thing, it’s just a fact of the matter and the current state of the industry. Looking at the chart above, which shows the weighted-average annual distribution growth of the Alerian MLP Index (AMZ), you’ll see that it is starting to look like an industry trend. If you take the results of 1Q17 and look at the trailing 12 months of distribution growth, that value looks more like 2.6%, only a touch higher than the 10-year low of 2.0% in 2009. Granted, since the AMZ is a market-cap weighted index, cuts from the larger equities have an outsized effect on the calculation. The truth is, most names in the AMZ have maintained or raised their distributions in recent years.
At the end of the day, by hitting the reset button, many of these MLPs are in far better financial positions and are now well-equipped to face future challenges, or take advantage of growth opportunities. Instead of needing to access the debt or equity markets to fund new growth, they could grow organically from internally generated cash flows. It’s not exactly a new model, Enterprise Product Partners (EPD) has been doing it for years to little fanfare, while very conservatively raising its distributions.
On the other hand, now that these companies have a lower base distribution rate, it’s possible that they decide to accelerate growth in the future. On July 19, 2017, Kinder Morgan announced that it expects a 60% dividend increase for 2018 and 25% annual dividend growth from 2018 through 2020. Granted, by the end of 2020, they’ll still be significantly below where they were before the 2015 cut, but it is a sign of progress. The main question is, will MLPs repeat past mistakes or will they be more prudent and follow in EPD’s footsteps? Like any market, there will be cycles of growth and recession. However, if KMI is a leading indicator, we could be primed to see growth again.

