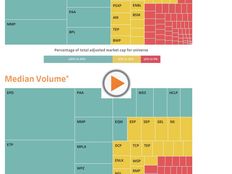
A picture is worth a thousand words. Today we’re using a new platform, called Tableau, to look at median daily trading volume as it relates to market cap.
Market capitalization is a simple math equation: current trading price x number of units outstanding. It’s a measure of how big a company is. Now, for this project, we’re using adjusted market cap, since oftentimes a large number of units are held by the management team or GP sponsor of an MLP, which means they’re not going to be traded in the market. Adjusted market cap represents the portion of the company that is publicly traded.
Liquidity is often evaluated by looking at daily trading volumes over a particular time period in terms of the dollar value of units traded or the number of units traded. In this analysis, we look at liquidity using median daily trading volume in dollar terms for the trailing 30-day period as of October 31, 2017. Why does liquidity matter? As we have discussed before, the more liquidity a stock has, the easier it is for investors to enter or exit a position without affecting the stock price. (This is not MLP-specific; it’s just how liquidity works.)
Let’s see what we can glean from these tree maps by first taking a look at the data. Note the toggle on the right hand side, which allows you to look at the data for the universe of MLPs used or a specific Alerian index. In the top tree map, the green boxes represent MLPs that make up the top 70% of the total universe’s adjusted market cap. Similarly, the green boxes in the lower tree map represent MLPs that make up the top 70% of the universe’s total median daily trading volume. Red boxes indicate those MLPs that are in the smallest 10% of the universe for adjusted market cap and median daily trading volume. Accordingly, the tree map for the Alerian Large Cap MLP Index (AMLI) is mostly green, and the tree map for the Alerian Small Cap Index (AMSI) is mostly red.

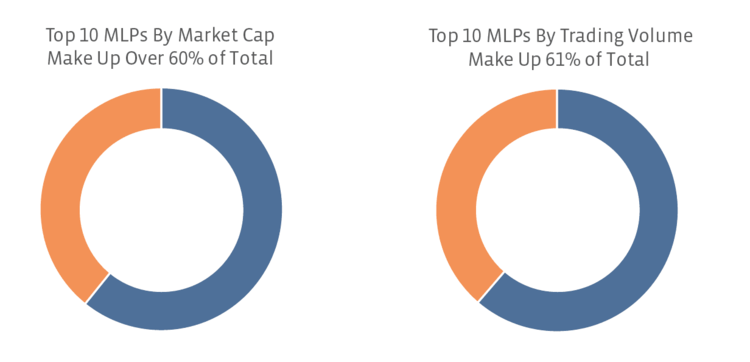
Considering that there are 103 MLPs represented and 10 MLPs make up over 60% of the total adjusted market cap and 61% of the total median daily trading volume, it’s clear that there is a significant bias toward large cap names. Given the number of consolidations in the past year, this trend has become even more pronounced.
Do the largest MLPs by market cap also have the most liquidity?
Not necessarily. This is one reason we adjusted the market capitalization numbers to include only units owned by the public. For instance, Spectra Energy Partners (SEP) has an adjusted market cap of around $3.5 billion, but a pure market cap of $13.7 billion. The difference is that the majority of the units are owned by parent company Enbridge Inc (ENB). SEP has a median daily trading volume of about $15 million worth of units. The comparison to market cap matters because compared to a market cap of $13.7 billion, $15 million isn’t much, but compared to $3.5 billion, SEP has normal liquidity in the MLP space. Still, even after the float adjustments are made, we find some anomalies.
Energy Transfer Equity (ETE) is the fourth largest MLP by adjusted market cap, just slightly smaller than Magellan Midstream Partners (MMP), which is number three. However, ETE had nearly double the trading volume of MMP over the trailing 30-day period. Even Plains All American (PAA), the seventh largest MLP, traded more than MMP.
What does it mean when trading volume and market cap are out of balance?
It’s important to remember that the trading volumes reflected in the tree map represent the trailing 30 days as of October 31, 2017. Many times, exaggerated (or muted) activity can simply be a result of an event specific to a particular company. For example, the last 30 days for ETE have been filled with news: ETE increased its distribution, priced debt, and announced project updates. PAA announced a distribution cut which was telegraphed in August. Both of these distribution announcements lead to increased trading: ETE following the announcement and PAA leading up to the ex-dividend date. In contrast, MMP had a relatively quiet month. It did announce a distribution increase, but since this was expected and in line with previous announcements, the market was not surprised.
These fundamental factors could be the reason for changes in trading volume. Alternatively, it could simply be that some MLPs are more hotly traded than others due to name recognition or unit pickers’ favorites. Or because active managers have chosen to trade in or out of a particular position that month.
No matter the cause, we always encourage MLP investors to know how liquid their investments are…which is why we like publishing visual data like this!

