The Rig Count: Less is More
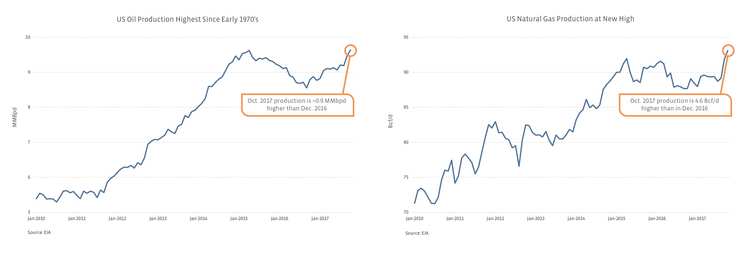
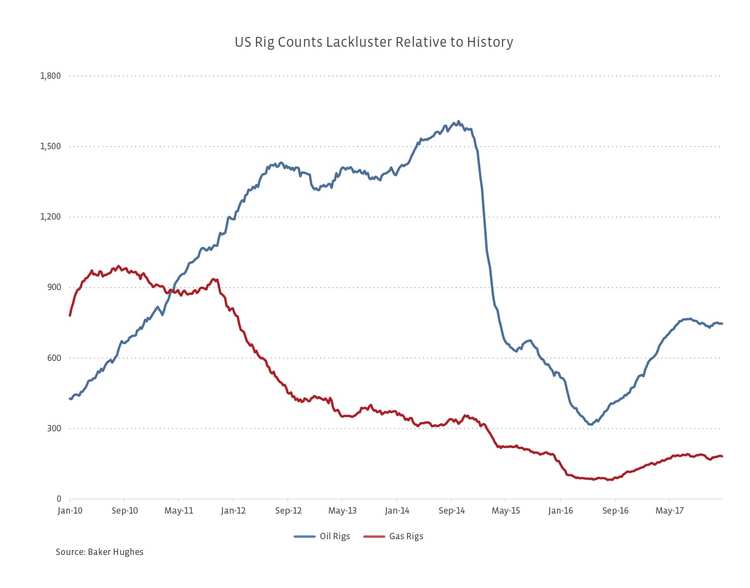
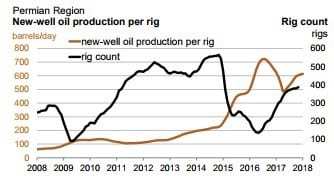
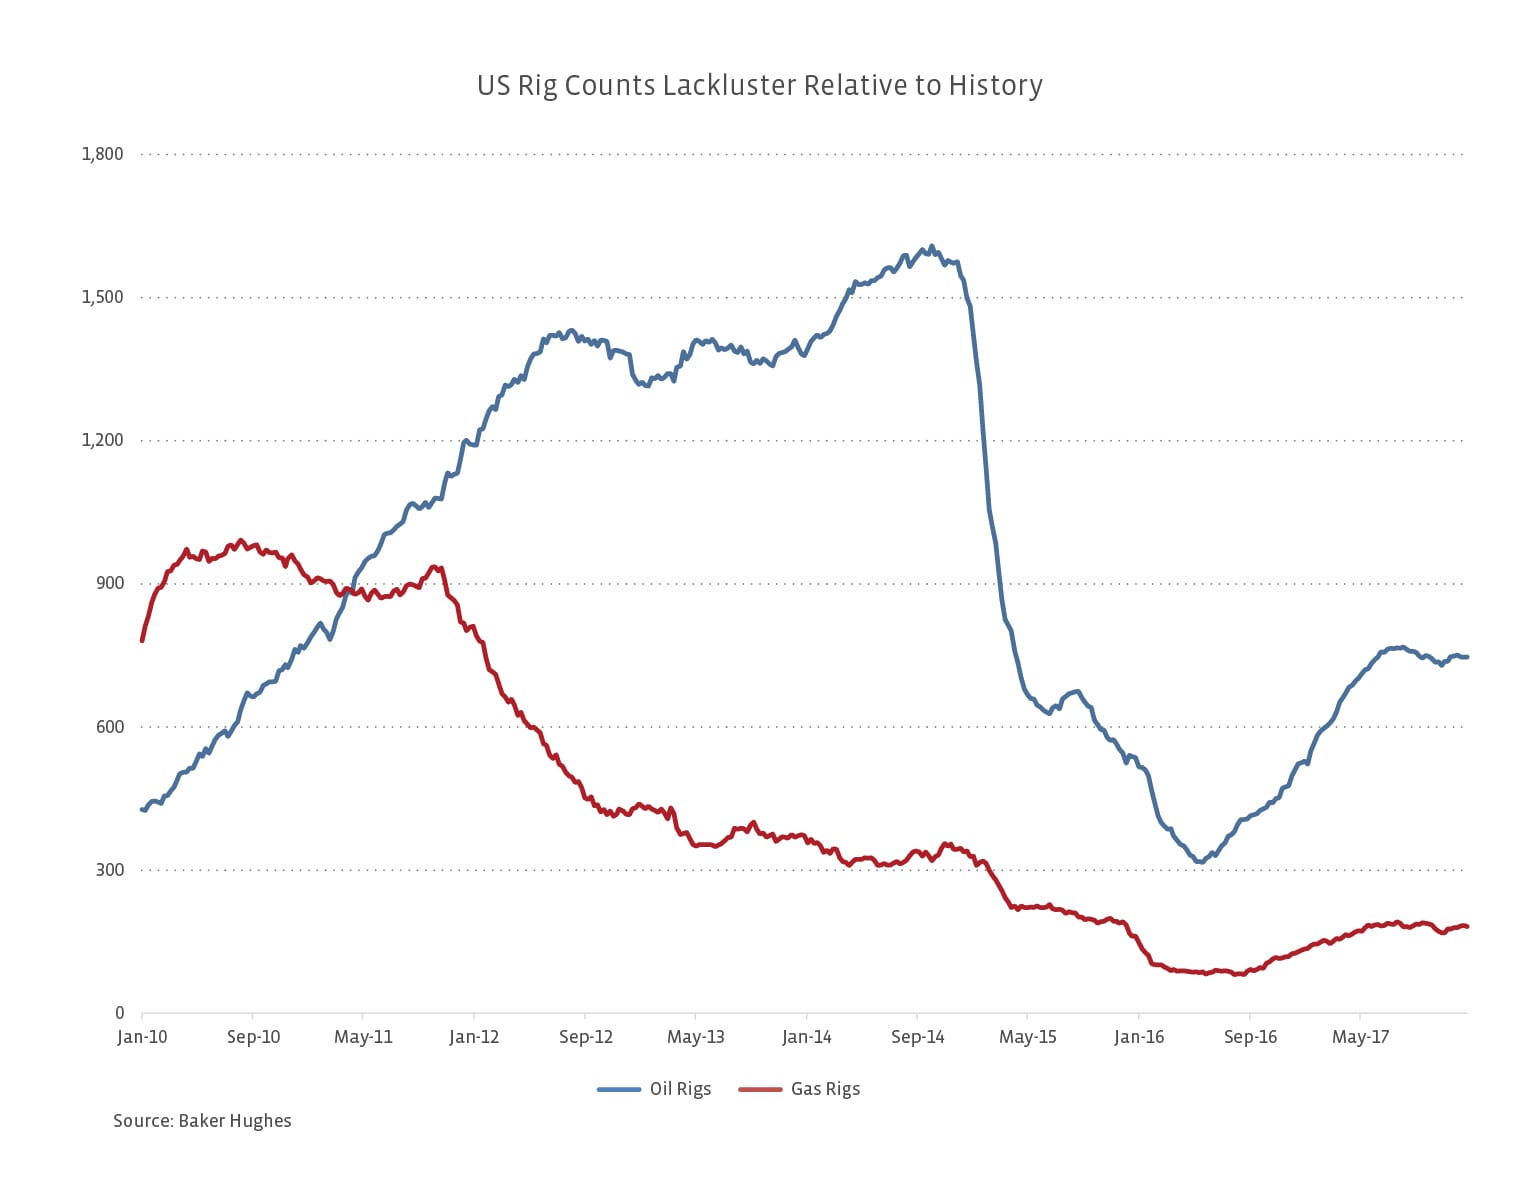
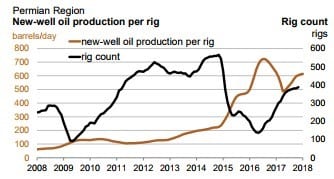
The number of oil and gas rigs in the US is down significantly from prior peaks but has recovered from the lows of 2016. For overall production to grow, new wells must offset the production decline from legacy wells. Keep in mind, a well produces at its highest rates in the first several months of production and then volumes begin to taper (see Permian well graphic below). If you were looking at rig counts in isolation and comparing today to the previous highs, you might expect US production to be hobbling along, but that’s not the case at all.
So, how has US oil and gas production managed to grow significantly with fewer rigs in the field? The easy answer is improved productivity. This is a function of many factors, including the type of well (horizontal vs. vertical), completion techniques, new drilling methods, and general improvements in technology. Another point to keep in mind is that operators shifted to their best acreage in the lower oil price environment of the last few years, which somewhat artificially inflates productivity. On the gas side, associated gas production (gas produced from an oil well) has also been growing, which explains a considerable portion of the growth in gas production despite the low number of active gas rigs.
Rig efficiencies have significantly improved in recent years. Multi-well pad drilling, which allows multiple wells to be drilled from one pad, started to gain traction in 2006 and significantly increases efficiency. Moving rigs used to require the rig to be disassembled and then reassembled in the desired location, but with pad drilling, rigs can be moved using hydraulic “legs” or skidding systems without having to be taken apart. Nowadays, there are even walking rigs that can move 360 degrees. With these developments and other improvements to the rigs’ drilling capabilities, wells can be drilled much more efficiently. As an example, oil and gas producer Hess (HES) has seen its spud to spud times (the time between starting to drill a well and starting the next well) fall from 50 days in 2010 to only 15 days in 1H17.
It’s also important to note that horizontal drilling has supported increased productivity relative to vertical drilling. Prior to 2012, less than 60% of rigs were drilling horizontally. Today, that percentage is almost 90%. Horizontal wells are more productive because the hydrocarbon-bearing formation is typically wider than it is tall. By drilling horizontally, the well has more exposure to the source rock and more oil or gas can be produced. The graphic below of Permian production per well clearly shows the drastic improvement in productivity over just a few years.
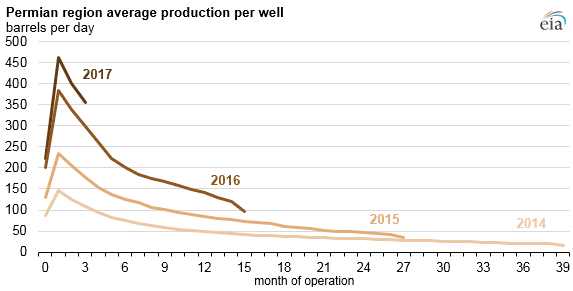
Source: U.S. Energy Information Administration, https://www.eia.gov/todayinenergy/detail.php?id=34212
Well productivity has also improved as producers have refined completion techniques. Completion includes hydraulic fracturing or “fracking” the well. As this 2014 overview of well completions from Drillinginfo explains, horizontal wells at the time typically had 30 to 40 frac stages compared to an average of nine stages per horizontal well in 2011. Additional frac stages help increase production from each well. Fun fact: the longest lateral well in the US had 124 frac stages and a lateral length exceeding 18,500 feet!
DUC, DUC, Goose egg production!
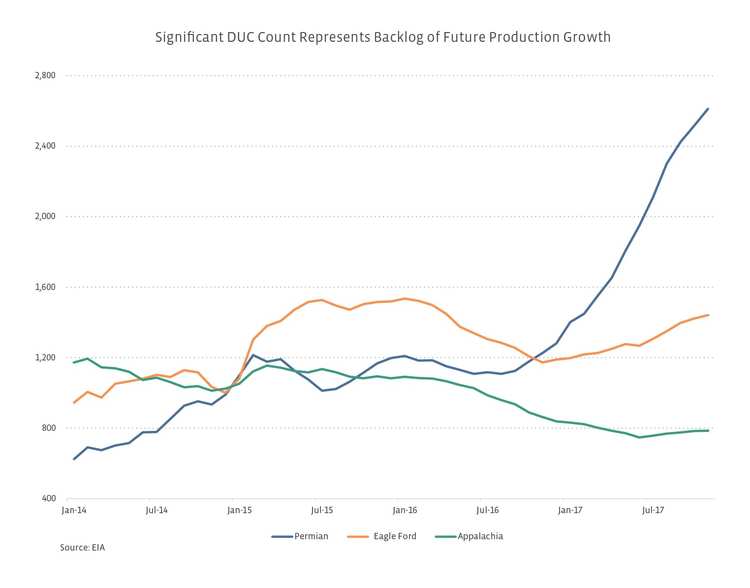
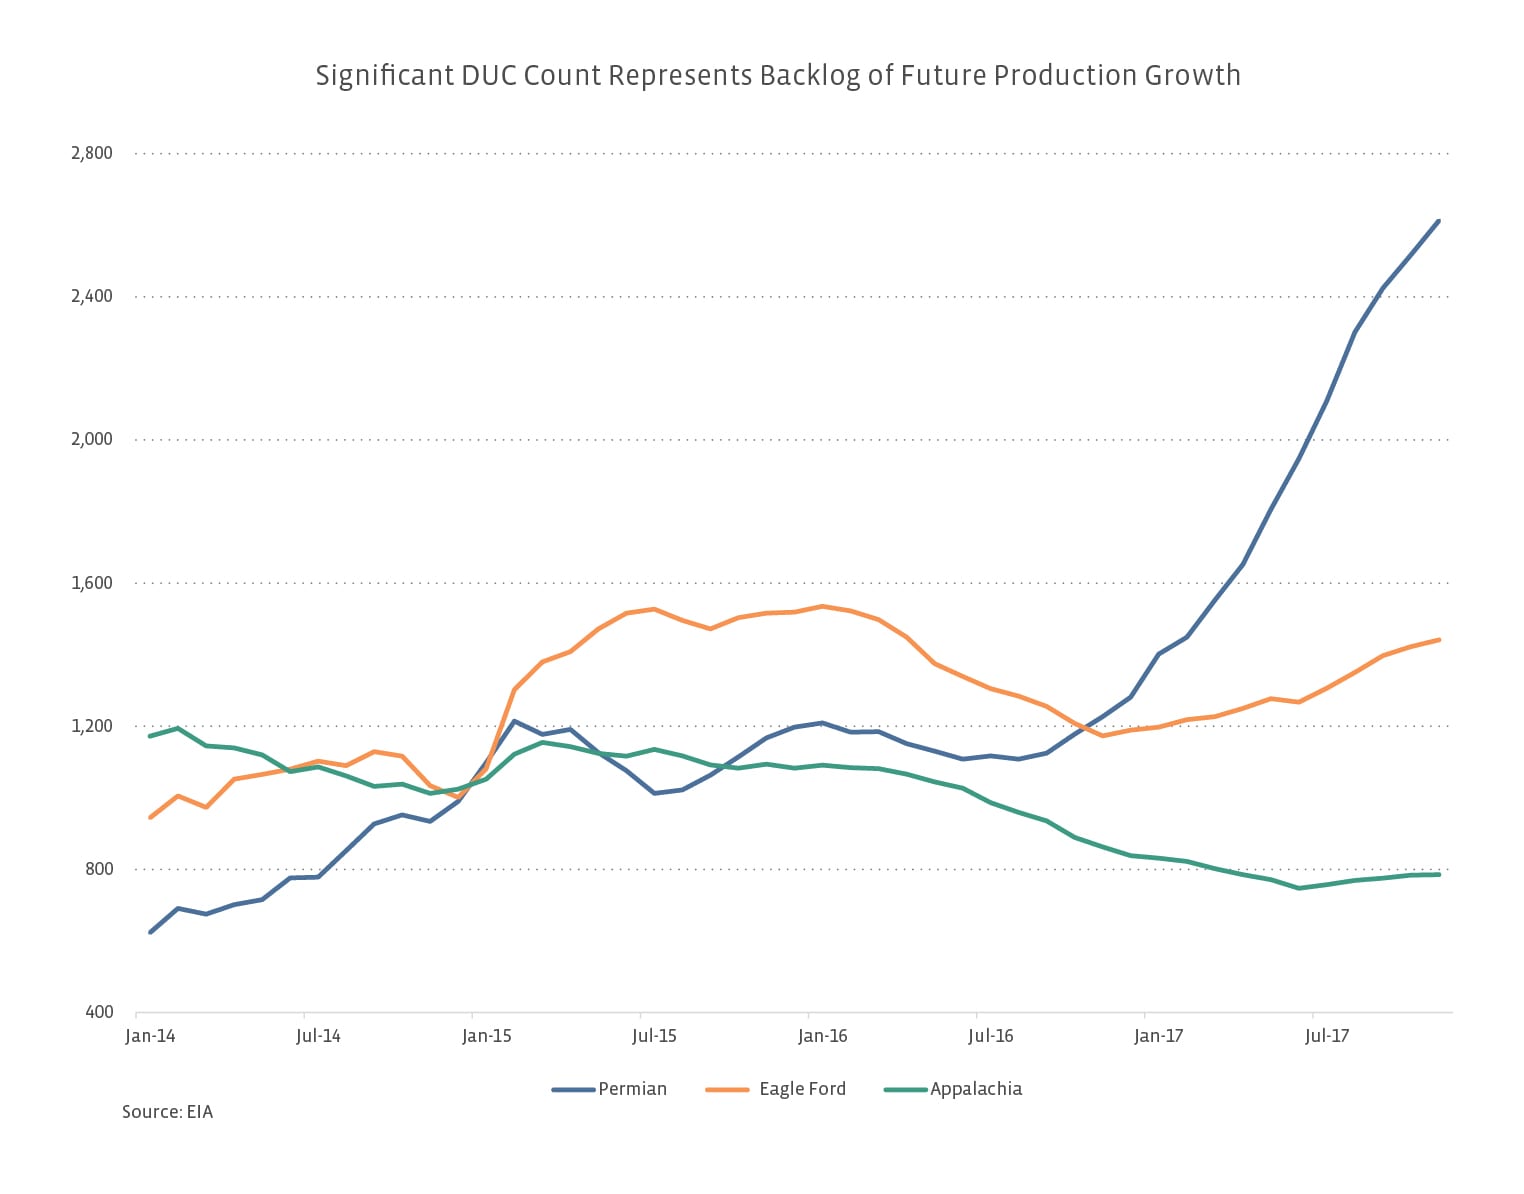
Another wrinkle in the relationship between the rig count and production growth comes from “drilled but uncompleted wells”, which are referred to as DUCs and pronounced “ducks”. A rig was used to drill the DUC, but there’s no production coming from it. As you can see from the chart below of select basins, DUCs have been steadily climbing for the Permian, but the number of DUCs has fallen from earlier highs for Appalachia and the Eagle Ford. A falling inventory means that more wells were completed than drilled, which implies more production coming online. A rising DUC inventory means that more wells were drilled than completed, which provides some visibility to future growth. Why would anyone drill a well and not complete it? There are many reasons, but it can often be a matter of waiting on frac fleets to become available or waiting on gathering capacity to be in place to take away the oil and gas produced. In the Permian today, there aren’t enough frac fleets available to meet the demand for completing wells.
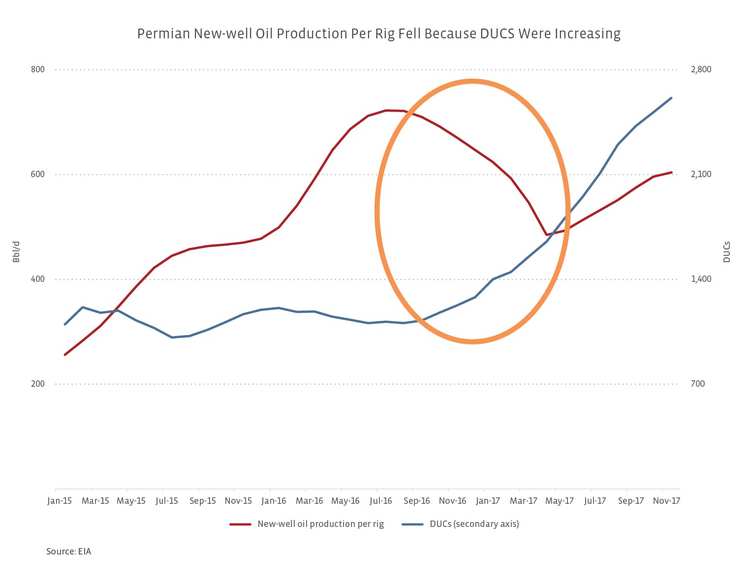
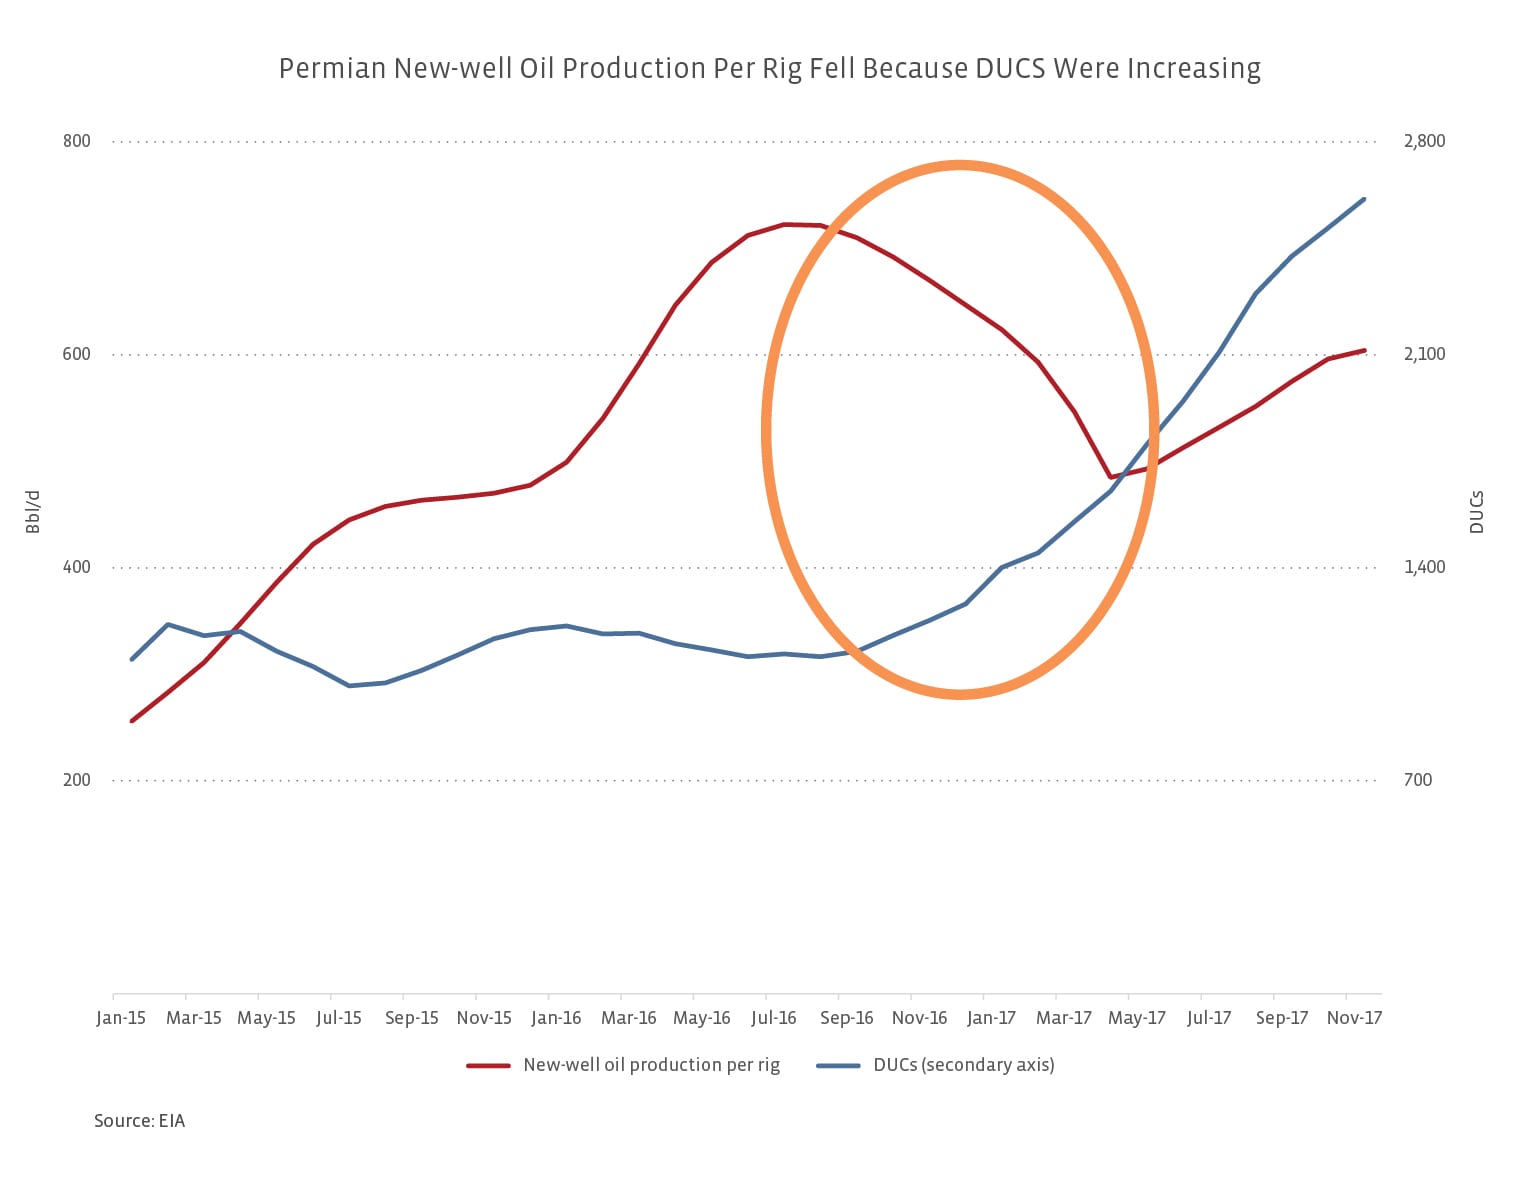
DUCs clearly complicate the picture between the rig count and production growth, especially considering the high number of DUCs in the Permian. Articles questioning the longevity of shale production or arguing that shale production is in jeopardy often refer to charts like the one below on the top. The decline in new-well oil production per rig in the Permian (circled) is sometimes cited as a sign that things are slowing down or productivity is declining. To the contrary, the decline in productivity per rig is reflective of a rising DUC inventory, as shown in the chart on the bottom. When the inventory of DUCs is growing, the rig count is not going to be an appropriate denominator for new production. Similarly, if DUCs are falling, measuring new production per rig will overstate the productivity of each rig.
Why should MLP investors care?
MLPs are volume-driven businesses, and increasing production of oil, gas, and NGLs in the US provides new growth opportunities for MLPs. Specifically, new production can drive higher volumes for Gathering & Processing MLPs and Pipeline Transportation MLPs as they develop infrastructure to process new production and get it to end markets. For perspective, of the 40 constituents in the AMZ Index, 31 MLPs are classified as Gathering & Processing or Pipeline Transportation MLPs. The over 2,600 DUCs in the Permian as of November are a good indicator of future production growth and the potential need for infrastructure. With that context, it’s no surprise that we’ve seen a slew of Permian oil and gas pipeline announcements in recent months. For a list of recent Permian crude pipeline announcements, see our post on crude spreads. On the gas side, Tellurian (TELL) announced the Permian Global Access Pipeline on December 18th and the final investment decision on the Gulf Coast Express Pipeline, a joint venture of Kinder Morgan (KMI), Targa Resources (TRGP) and DCP Midstream (DCP), was announced a few days later.
Bottom Line
The Baker Hughes rig count remains an important gauge of US upstream activity. However, with the dramatic improvement in productivity over recent years, less is more. In other words, more can be achieved with fewer rigs than in the past. Despite the oil and gas rig count being well off prior highs, US production has seen solid growth and the growing backlog of DUCs indicates that more growth could be coming. This should be encouraging for MLP investors, because more production requires more infrastructure.

