What is the international energy outlook for 2016?
The reading schedule at my high school was grueling. The first book we were assigned was Wuthering Heights and we had two weeks to read it. It seemed like tons of time until it was the day before the test and I hadn’t read a single word. I did the only thing I could and read the CliffsNotes. I made a 72 on the exam, my first ever C. That was my last experience with CliffsNotes. As it turns out, actually reading the books produced much better grades. Today, however, I’m going to give you the “KarylsNotes” version of the International Energy Outlook 2016 (IEO2016) published by the US Energy Information Administration (EIA) last week. My hope is to hit the high points and give you at least a passing rate of understanding on the matter should the need arise.
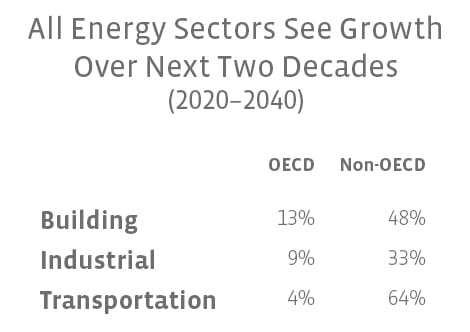
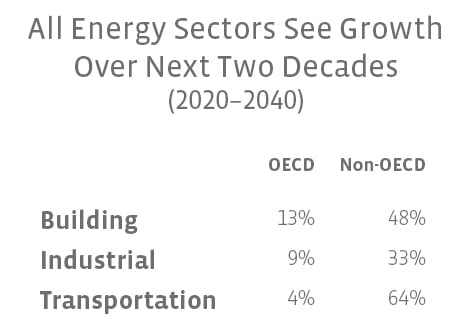
First and foremost, using the EIA’s reference case, demand is estimated to increase by about 48% over the study’s projection period which began in 2012 and runs through 2040. In 2012, total world energy consumption was 549 quadrillion Btu. Consumers in 2040 are predicted to use roughly 815 quadrillion Btu. The bulk of this increase is expected to come from countries that are not members of the Organization for Economic Cooperation and Development (OECD) and over 50% of the anticipated growth is specifically attributed to non-OECD Asia. Due to what the EIA describes as “major sources of uncertainty”, there is both a high and low economic growth case presented in the study, as well as the reference case that takes the median of the two. (Sound familiar?) In the high case, world energy use in 2040 reaches 862 quadrillion Btu and in the low case, totals would be around 764 quadrillion Btu. Unfortunately, there is not an option for an easy comparison between the last International Energy Outlook (released in 2014) and the current version, as the 2014 report was a shortened edition, only looking at liquid fuels. We can, however, see that the reference case for consumption of liquid fuels has increased slightly between the 2014 and 2016 reports, from 243 quadrillion Btu in 2040 to 246 quadrillion Btu.
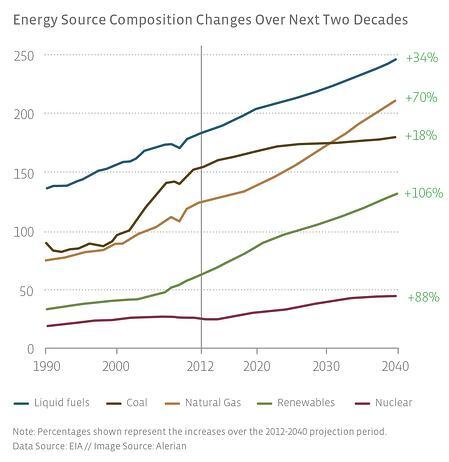
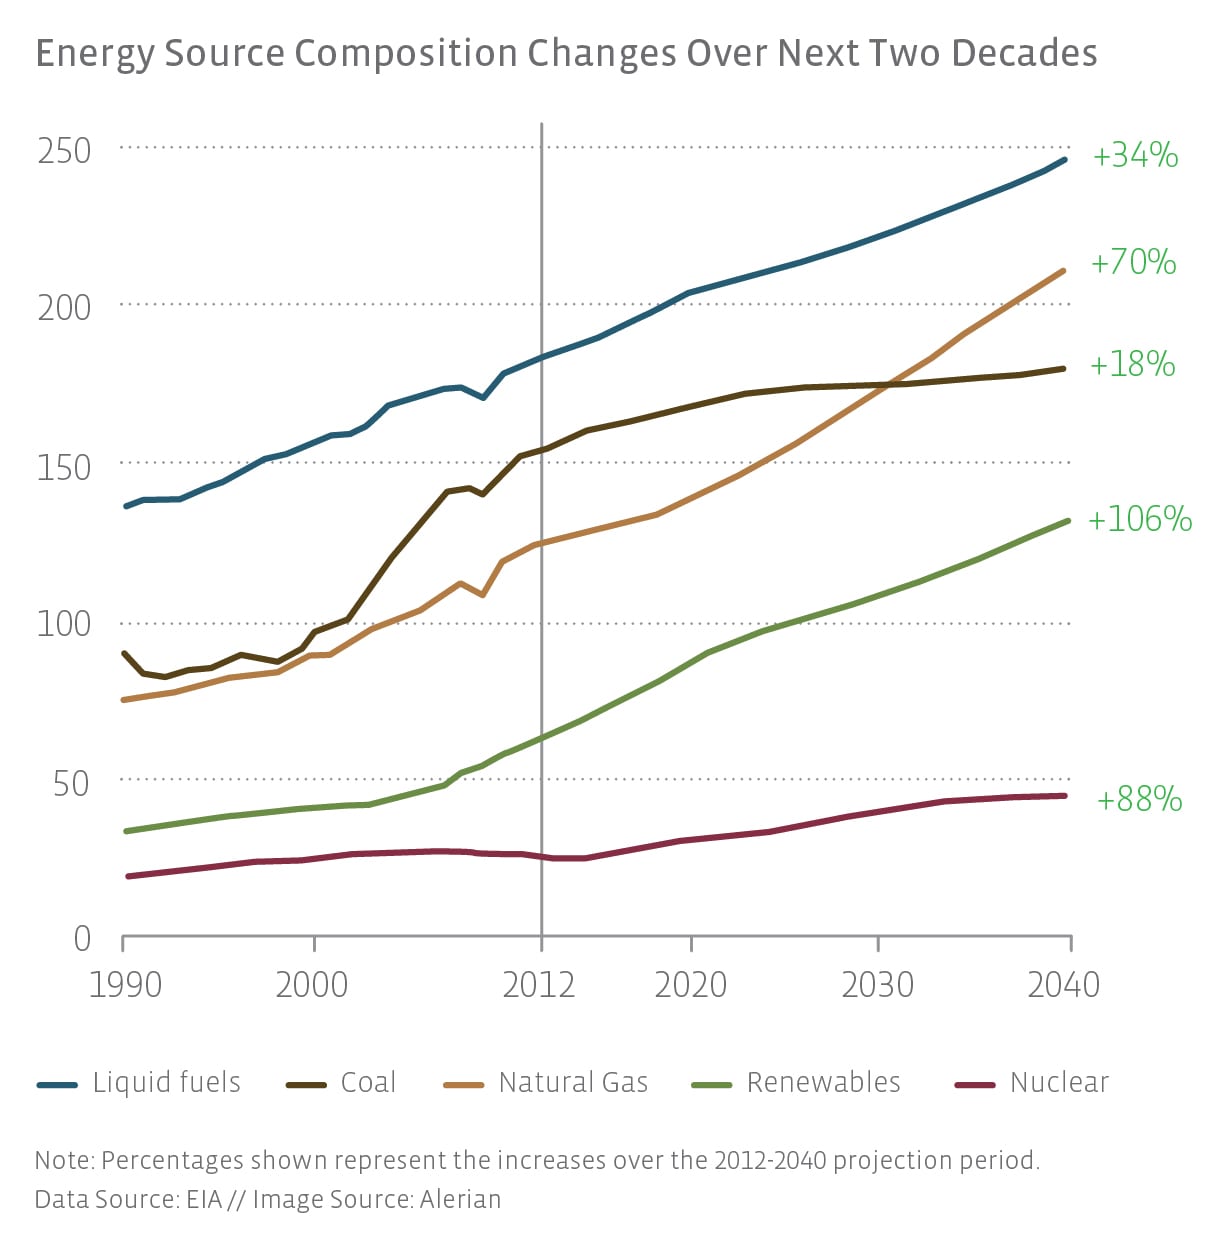
The make-up of the energy consumed will differ from what we’ve seen in the past. For example, by 2030, it’s projected that worldwide natural gas use will surpass coal use. We’ve already seen this happen in the US. Further, renewables are anticipated to be the world’s fastest growing energy source over the study’s projection period, growing at a rate of 2.6% per year. Even with this growth, however, fossil fuel consumption will still be king. The EIA estimates that in 2040, 78% of the world’s energy use will still come from traditional sources. The chart below shows the projected mix of energy sources through 2040. It’s important to note that finalizing the Clean Power Plan (CPP) could affect these projections. The CPP seeks to reduce carbon pollution from power plants, putting significant restrictions on coal operations. Because of this, coal use could dip further and renewable energy use could exceed expectations.


