
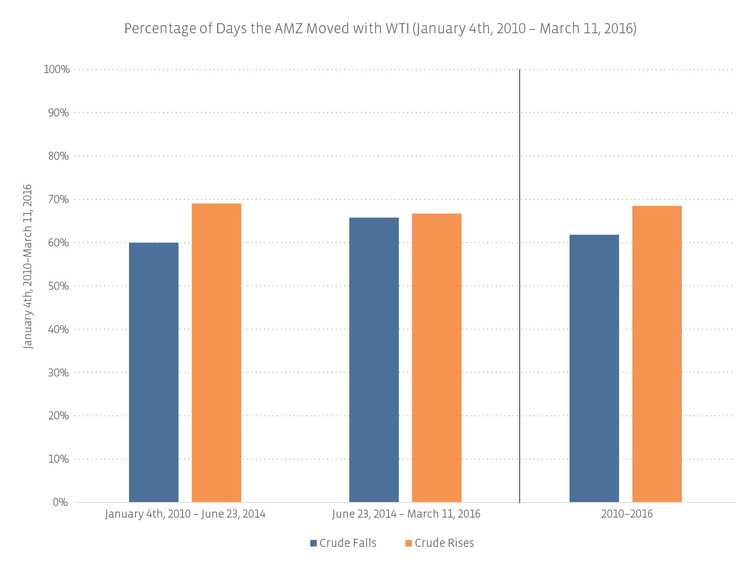
Since correlation is best measured monthly over three years, we also examined daily interactions with MLPs and WTI, but only over the past five years, and even split that into Before the Commodity Crisis (BCC) and After Commodity Crisis (ACC). Ignoring magnitude and looking only at direction, the AMZ has tended to move with WTI more generally since the Commodity Crisis. As a reference, over the past five years, the AMZ moved in the same direction as WTI 65.1% of the time. As a further reference, if I flipped a coin every day and heads was positive and tails was negative, this chart would show that coin flipping (aka randomness) would move with WTI 50% of the time.
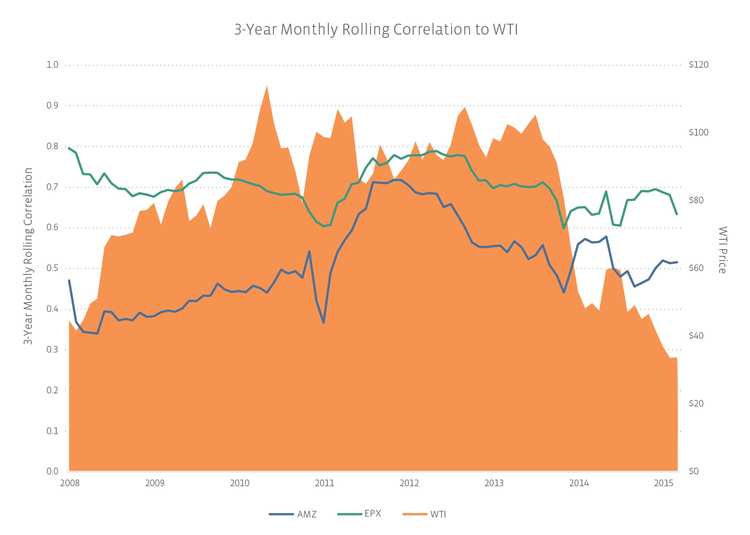
In examining historic correlations, it’s fascinating to watch correlations climb during the energy renaissance. New drilling technologies combined with stable prices around $100 led to a massive need for more energy infrastructure in North America. As a possible theory for the rising correlation: when oil prices rose, investors traded MLPs up as well, anticipating the need for more pipelines, storage tanks, and processing plants. It wasn’t the crude price per se that drove MLP prices, but that price implied volume which implied infrastructure.
This may be the same reason correlation spiked initially as crude fell: if WTI is below a breakeven price, then volumes will fall and the expected infrastructure will no longer be needed. However, correlations are now returning to what may be considered a more normalized level. Normal is, of course, in the eye of the beholder. Over the past ten years, the overall monthly correlation between AMZ and WTI, the average three-year rolling correlation, and the median three-year rolling correlation are all 0.5.
So, investors may be disappointed if they are waiting for a crude oil recovery due to assumptions that their MLP portfolio will also rise in lockstep. In fact, if an investor is expecting a crude oil recovery, the best way to invest in that will be to buy crude oil futures themselves. The next best way would be to buy the E&P companies who have direct commodity price exposure, as their correlations typically range from 0.6-0.8 to crude prices. MLP investors, as always, are those people who want to invest in the build-out of energy infrastructure over the next several decades.

