High-Level Takeaways
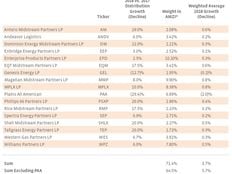
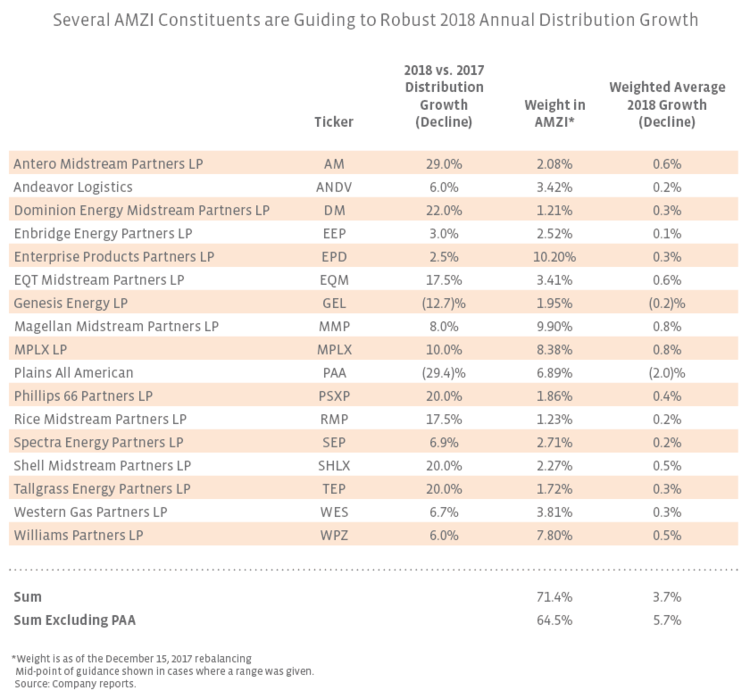
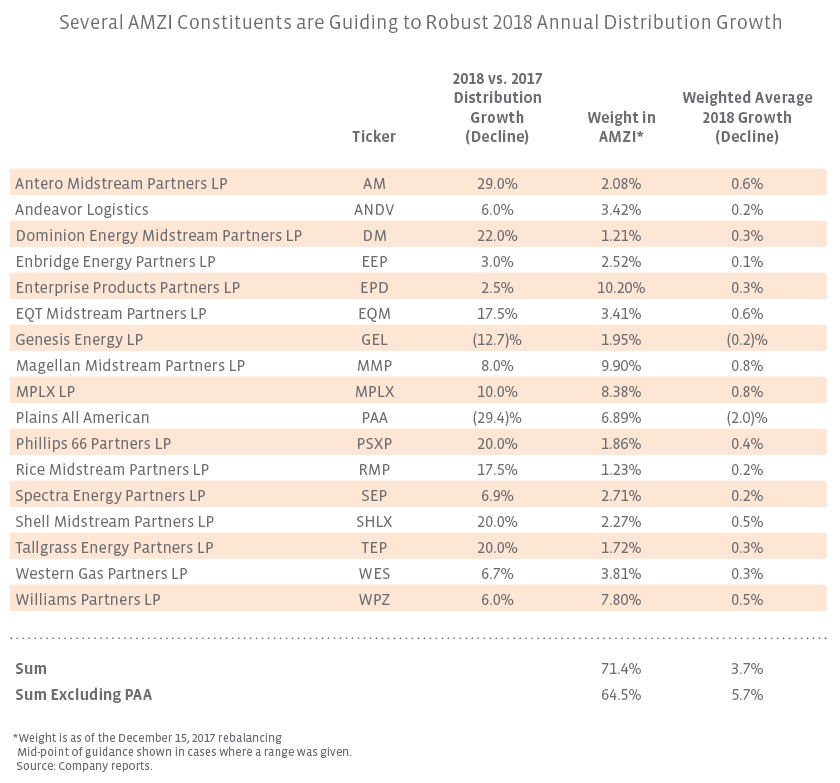
Of the 17 constituents listed in the table, eight expect to grow their annual distribution by 10.0% or more in 2018. Five constituents expect distribution growth of 20.0% or more. Taking the guidance of the 17 constituents in aggregate, representing 71.4% of the index by weight as of the December 15, 2017 rebalancing, the weighted average annual distribution growth for 2018 is 3.7%. The distribution cut by PAA in 3Q17 and PAA’s plans to likely maintain a flat distribution for six quarters is a significant drag on the weighted average for the group. Excluding PAA, 64.5% of the index shows weighted average annual distribution growth of 5.7%.
The High-Growth Group
There are five constituents guiding to 2018 distribution growth of 20.0% or more. Antero Midstream Partners (AM) guided to 28.0%-30.0% annual distribution growth and Dominion Energy Midstream Partners (DM) targets 22.0% annual distribution growth – both MLPs’ respective targets are through 2020. Shell Midstream Partners (SHLX) is forecasting 20.0% growth in 2018 and mid-teens growth for 2019. Tallgrass Energy Partners (TEP) previously guided to distribution growth of ~20.0% for 2018 as part of long-term guidance originally given in May 2016. Phillips 66 Partners (PSXP) targets a 30.0% compound annual growth rate from 4Q13 through 2018, but that doesn’t necessarily equate to 30.0% annual growth in 2018, particularly given steeper distribution growth in the early years of the guidance range. In the table, we show 2018 annual growth of 20.0%, which is conservative relative to consensus expectations for distribution growth of 22.0% and PSXP’s 21.7% annual growth for 2017.
Annual distribution growth for EQT Midstream Partners (EQM) and Rice Midstream Partners (RMP) is expected to be 15.0%-20.0% for several years on a standalone basis for each. EQT Corporation (EQT), which is the sponsor of both MLPs following its acquisition of Rice Energy, is evaluating a simplified business structure for the midstream entities it controls.
The Decliners
The decrease in the distribution for PAA, which cut its 3Q17 distribution and seems set to leave its distribution at $0.30 per unit through 2018, weighs on the overall distribution growth for the group. GEL also cut its distribution for 3Q17 and plans to grow its distribution by no less than $0.01 per unit per quarter beginning with the 4Q17 distribution that was recently announced. The numbers in the chart assume the minimum growth of $0.01 per unit per quarter, so there could be upside to what’s presented.
While the annual percentage declines in the table look bleak, it’s important to note that GEL is guiding to distribution growth on a quarterly basis. Assuming the minimum of $0.01 per quarter growth, GEL’s distribution in 4Q18 will be nearly 8% higher than its 4Q17 distribution ($0.55 vs. $0.51 per unit). Similarly, assuming PAA continues to pay $0.30 per quarter through 4Q18, its distribution will be flat relative to 4Q17. The baseline for comparison makes a big difference!
Holding Steady
Five constituents have maintained a flat quarterly distribution for more than a year. To be clear, we are not saying that these distributions will continue to be held flat. This is just historical information for context. Combined, these five companies represent 9.3% of the index by weighting.
| AMZI Constituent | Ticker | Quarterly Distribution per Unit | Paid at that Level Since: |
| Boardwalk Pipeline Partners | BWP | $0.10 | 4Q13 |
| DCP Midstream | DCP | $0.78 | 4Q15 |
| Enlink Midstream | ENLK | $0.39 | 3Q15 |
| NGL Energy Partners | NGL | $0.39 | 1Q16 |
| NuStar Energy | NS | $1.095 | 2Q11 |
The Rest – Likely Includes Some Growers
-
Buckeye Partners (BPL) kept its distribution flat at $1.2625 for 3Q17, after 18 straight quarterly increases, citing that the market is not adequately rewarding distribution growth, and greater value could be generated by retaining capital given BPL’s yield at the time.
Energy Transfer Partners (ETP) will continue to evaluate distribution increases each quarter. ETP increased its distribution for 3Q17 to $0.5650 per unit, which represented an increase of 10.8% relative to the 3Q16 distribution.
Holly Energy Partners’ (HEP) 3Q17 distribution of $0.6450 per unit represented its 52nd consecutive quarterly distribution increase and growth of 8.4% compared to 3Q16. Management is reevaluating the rate of distribution growth in 2018, as indicated at the HollyFrontier (HFC) Analyst Day in December.
TC PipeLines’ (TCP) history shows a pattern of increasing the distribution in the second quarter of each year and then holding it flat for the next three quarters. TCP boasts 18 consecutive years of distribution increases and expects future increases given anticipated growth. TCP’s 3Q17 distribution was $1.00 per unit — a 6.4% increase relative to the 3Q16 distribution.
Bottom Line:
Several MLPs are forecasting robust annual distribution growth in 2018. On an aggregate basis, more than 70% of the AMZI index by weight is guiding to weighted average annual distribution growth of nearly 4% in 2018 relative to 2017, including the impact of cuts from PAA and GEL. The growth would be skewed higher if considering the growth from 4Q17 to 4Q18. Additional upside (or downside) could come from the MLPs that did not provide 2018 guidance. While guidance can change, the strong expectations for 2018 distribution growth for many MLPs may be surprising to investors that were frustrated by the sector’s underperformance in 2017. While self-funding has taken the spotlight, distribution growth isn’t exactly playing second fiddle.

