
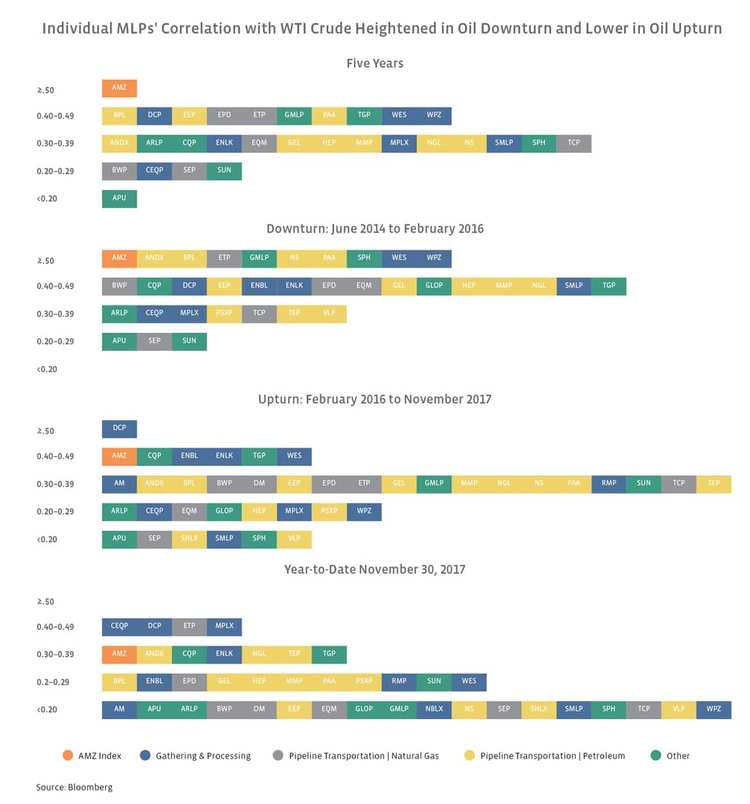
Data Note: All correlation data was sourced from Bloomberg. The five-year correlation is based on weekly correlations from November 30, 2012 to November 30, 2017. The correlation during the oil downturn is based on weekly correlations from June 20, 2014 to February 11, 2016. The correlation during the oil upturn is based on weekly correlations from February 12, 2016 to November 30, 2017. Correlations for year-to-date 2017 were based on weekly correlations through November 30, 2017.
Key Takeaways from MLPs’ Crude Correlations
- Across the four periods analyzed, an individual MLP’s correlation with WTI crude did not exceed 0.61, even in oil’s downturn.
- While one may expect Pipeline Transportation | Petroleum MLPs (yellow boxes) to have the highest crude correlations, that wasn’t necessarily the case. Gathering & Processing MLPs (blue boxes) also exhibited high correlations with WTI. This makes sense given that Gathering & Processing is driven by NGL processing economics and actual production, which can be sensitive to crude prices.
- The WTI correlations for Pipeline Transportation | Petroleum MLPs (yellow boxes) were more pronounced during oil’s downturn, with nine Pipeline Transportation | Petroleum MLPs having correlations at or above 0.40. Interestingly, on a year-to-date basis, no Pipeline Transportation | Petroleum MLPs have crude correlations at or above 0.40. This further underscores the lack of MLP participation in crude’s rally.
Amerigas Partners (APU) consistently exhibited a low correlation with WTI, as one would expect given APU is the largest retail propane marketer in the US. Spectra Energy Partners (SEP) also had a relatively low WTI correlation in each scenario. SEP highlights that all its business is fee-based and that greater than 90% of its revenues come from fees reserving space on pipelines and in storage capacity.
DCP Midstream (DCP), Western Gas Partners (WES), Energy Transfer Partners (ETP) and Plains All American (PAA) tended to have high WTI correlations in the four timeframes. However, both WES and PAA have exhibited lower crude correlations year-to-date through November 30, 2017. Why the relatively higher crude correlations for these names? DCP explains in its annual report that results from its natural gas services segment are impacted by variability in natural gas, crude, and NGL prices and provides commodity sensitivities in its investor presentation. WES’ operations are focused largely on liquids-rich basins, specifically the DJ Basin and Delaware Basin. ETP is a special case because of the merger with Sunoco Logistics Partners (former ticker SXL) and the fact that its historical performance largely reflects the trading history of SXL units. PAA is classified as a Pipeline Transportation | Petroleum MLP and has a liquids-focused asset base, which includes the Permian but also less cost-competitive regions such as the Bakken and Canada.
A Word of Caution
Historical correlations should be taken with a grain of salt because they are inherently backwards-looking. Correlations are also dynamic, making them somewhat of a moving target. We would also be remiss to not mention that correlations do not imply causation. That said, there is still value to looking at crude correlations and possible reasons for increases or decreases in correlations. Again, for a more comprehensive discussion of MLPs’ heightened correlation with WTI as oil fell and lower correlation as WTI has improved and possible reasons, please see the white paper.

