ETFdb Logo
  • ETF Database
  • Content Hubs
    • Themes
      • Active ETF
      • Alternatives
      • Artificial Intelligence
      • China Insights
      • Core Strategies
      • Crypto
      • Disruptive Technology
      • Energy Infrastructure
      • ETF Building Blocks
      • ETF Investing
      • ETF Strategist
      • Financial Literacy
      • Fixed Income
      • Free Cash Flow
      • Future ETFs
      • Innovative ETFs
      • Institutional Income Strategies
      • Leveraged & Inverse
      • Market Insights
      • Market Outlooks
      • Modern Alpha
      • Nuclear Energy
      • Portfolio Strategies
      • Sector Investing
      • Tax Efficient Income
      • Thematic Investing
    • Asset Class
      • Equity
        • U.S. Equity
        • Int'l Developed
        • Emerging Market Equities
      • Alternatives
        • Gold/Silver/Critical Materials
        • Cryptocurrency
        • Currency
        • Volatility
      • Fixed Income
        • Investment Grade Corporates
        • US Treasuries & TIPS
        • High Yield Corporates
        • Int'l Fixed Income
    • ETF Ecosystem
    • ETFs in Canada
    • Market Outlook
    • Crypto ETF Hub
  • Tools
    • ETF Screener
    • ETF Country Exposure Tool
    • ETF Database Categories
    • Indexes
    • Scenario Analysis
    • Watchlists
    • Head-To-Head ETF Comparison Tool
    • Mutual Fund To ETF Converter
    • ETF Stock Exposure Tool
    • ETF Issuer Fund Flows
  • Research
    • ETF Education
    • Equity Investing
    • Dividend ETFs
    • Leveraged ETFs
    • Inverse ETFs
    • Index Education
    • Index Insights
    • Top ETF Sectors
    • Top ETF Issuers
    • Top ETF Industries
  • Webcasts
  • Sectors
    • Sector Investing Content Hub
    • XLK
    • XLI
    • XLU
    • XLY
    • XLP
    • XLRE
    • Sector Power Rankings
    • XLE
    • XLC
    • XLF
    • XLV
    • XLB
  • Multimedia
    • ETF 360 Video Series
    • ETF of the Week Podcast
    • Gaining Perspective Podcast
    • ETF Prime Podcast
    • Video
  • Company
    • About VettaFi
  • PRO
    • Pro Content
    • Pro Tools
    • Advanced
    • FAQ
    • Free sign up
    • Login
  1. Index Insights
  2. Why MLPs Are Down: Rig Count? Volumes?
Index Insights
Share

Why MLPs Are Down: Rig Count? Volumes?

Maria HalmoSep 01, 2015
2015-09-01

In a previous post, we examined how MLPs remain uncorrelated to commodity prices, even in this environment. And yet, the Alerian MLP Index (AMZ) is down more than 20% on a total return basis for the year. We wanted to take the time to probe a little deeper.

Since most MLPs generate fee-based cash flows for handling crude oil and natural gas, the first stop is the health of the energy business. One prominent indicator—if you want something more exact than the facial expressions of talking heads—is the rig count. Baker Hughes publishes this data on a weekly basis, and as it measures the level of drilling activity, it is considered to be a gauge for the industry’s health (or lack thereof).

This is the image alt text

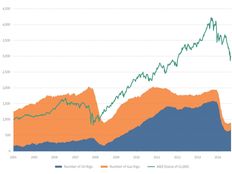
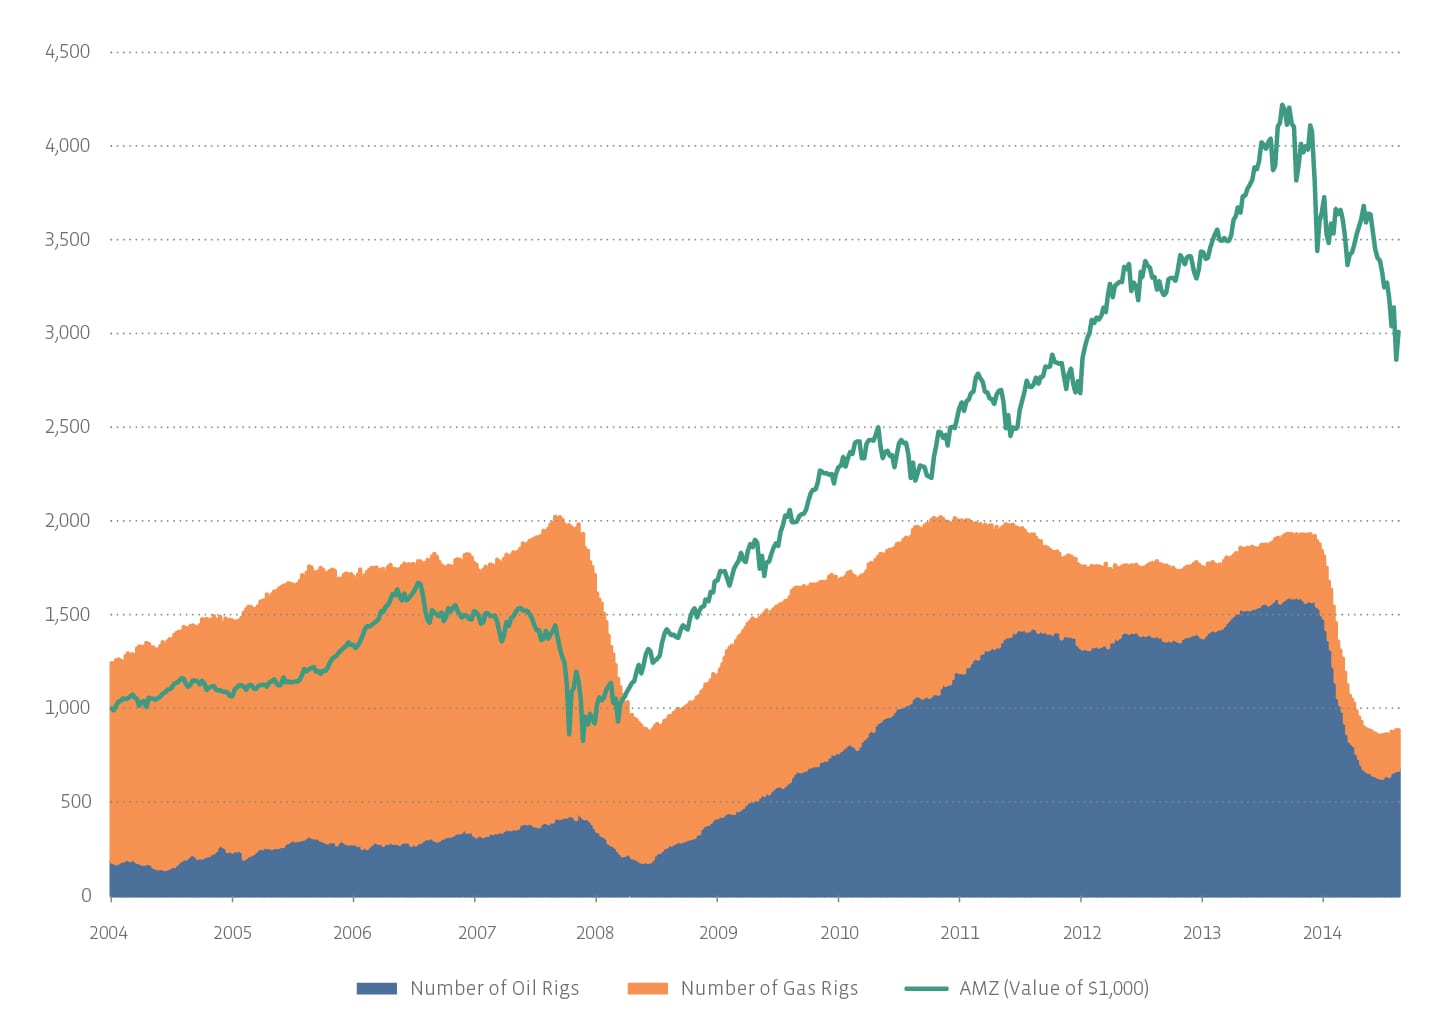
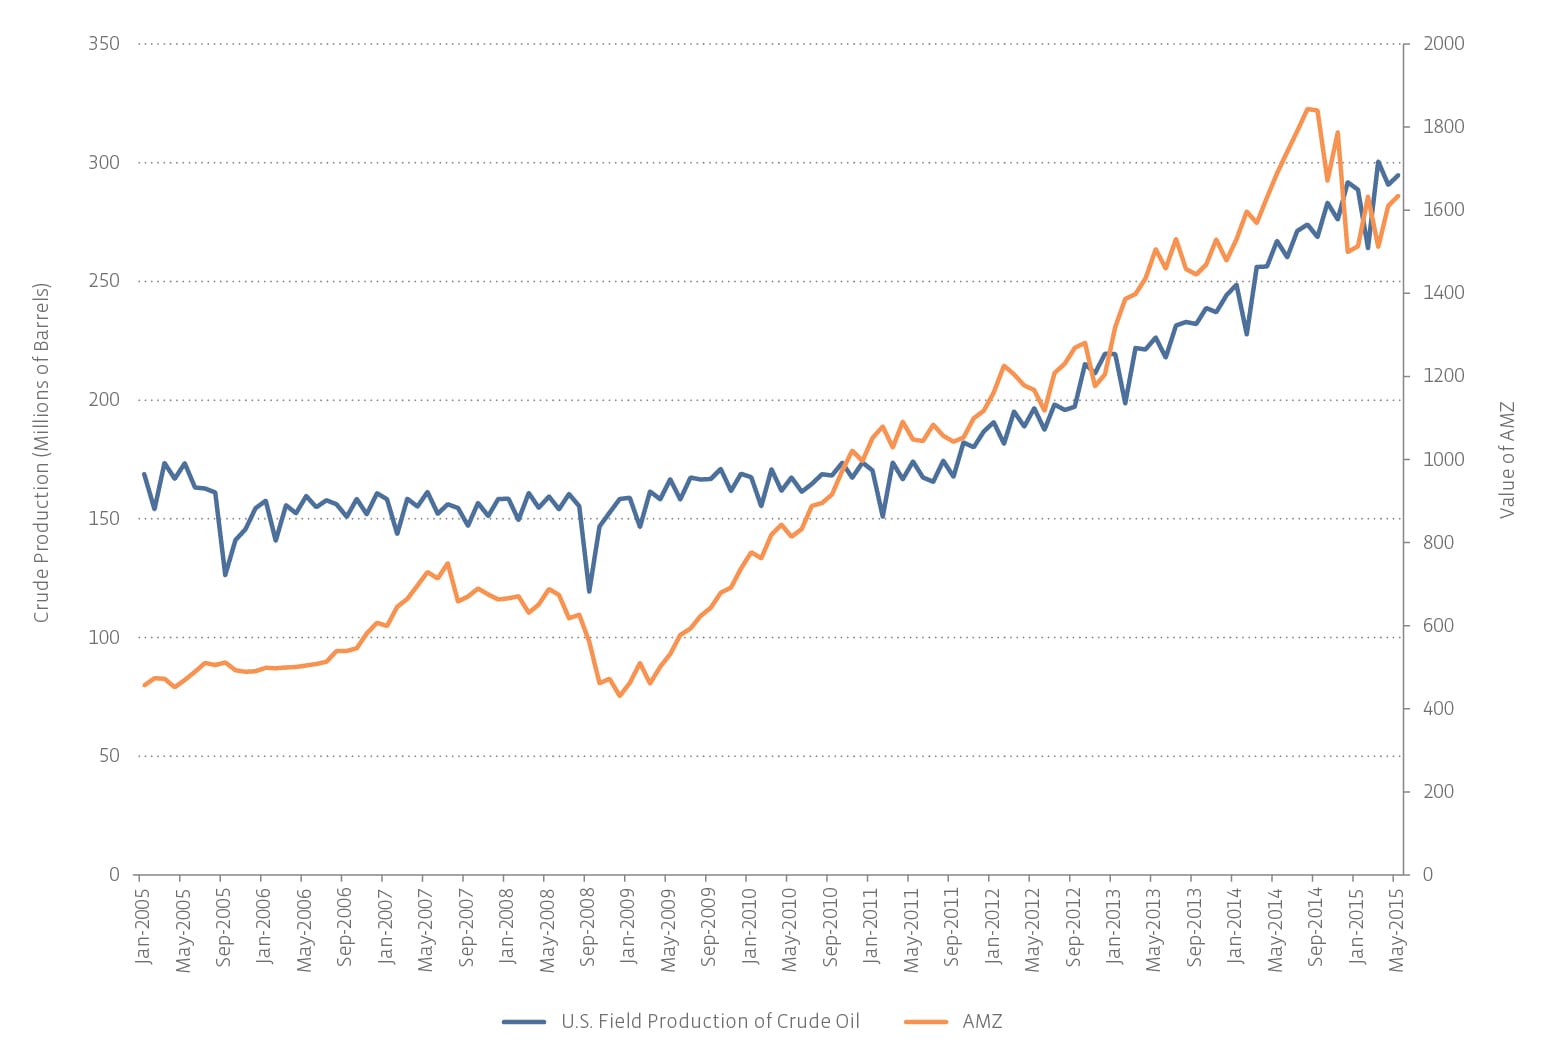
Most interesting is the 2009-2014 period, when rig counts remained relatively stable, and yet the AMZ continued to climb dramatically. During this time, wellhead spacing got tighter (more wells per acre), laterals got longer (horizontal drilling extends further), and frac stages got smaller (more fracs per well), resulting in significant increases in production per rig. So while rig counts were fairly constant, production rose significantly during the last five years.


Content continues below advertisement

This is the image alt text

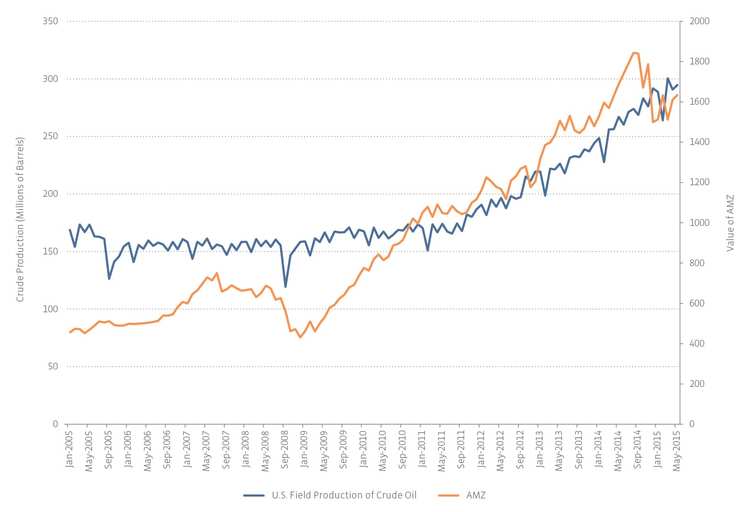
Since only one oilfield service company has ever been an AMZ constituent, it makes sense that the index has a lower correlation to rig counts (0.34) and a higher correlation to crude production (0.90). That high correlation number is quite striking, and I was tempted to label this the “Ah-HA!” moment and make it the whole point of this piece—that MLPs, having a price times volume business model, are heavily dependent on crude production. But when we examine correlations on a rolling 30-month basis, rather than over the entire 10-year period, a very different picture emerges.

This is the image alt text

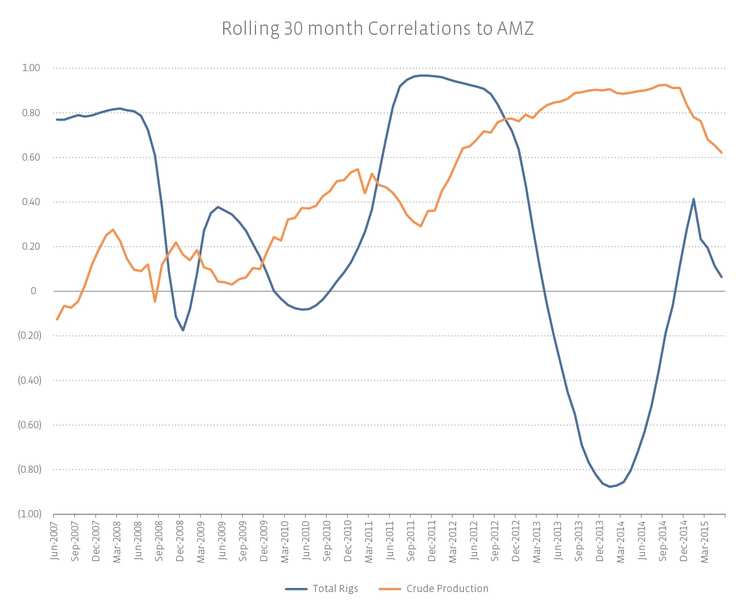
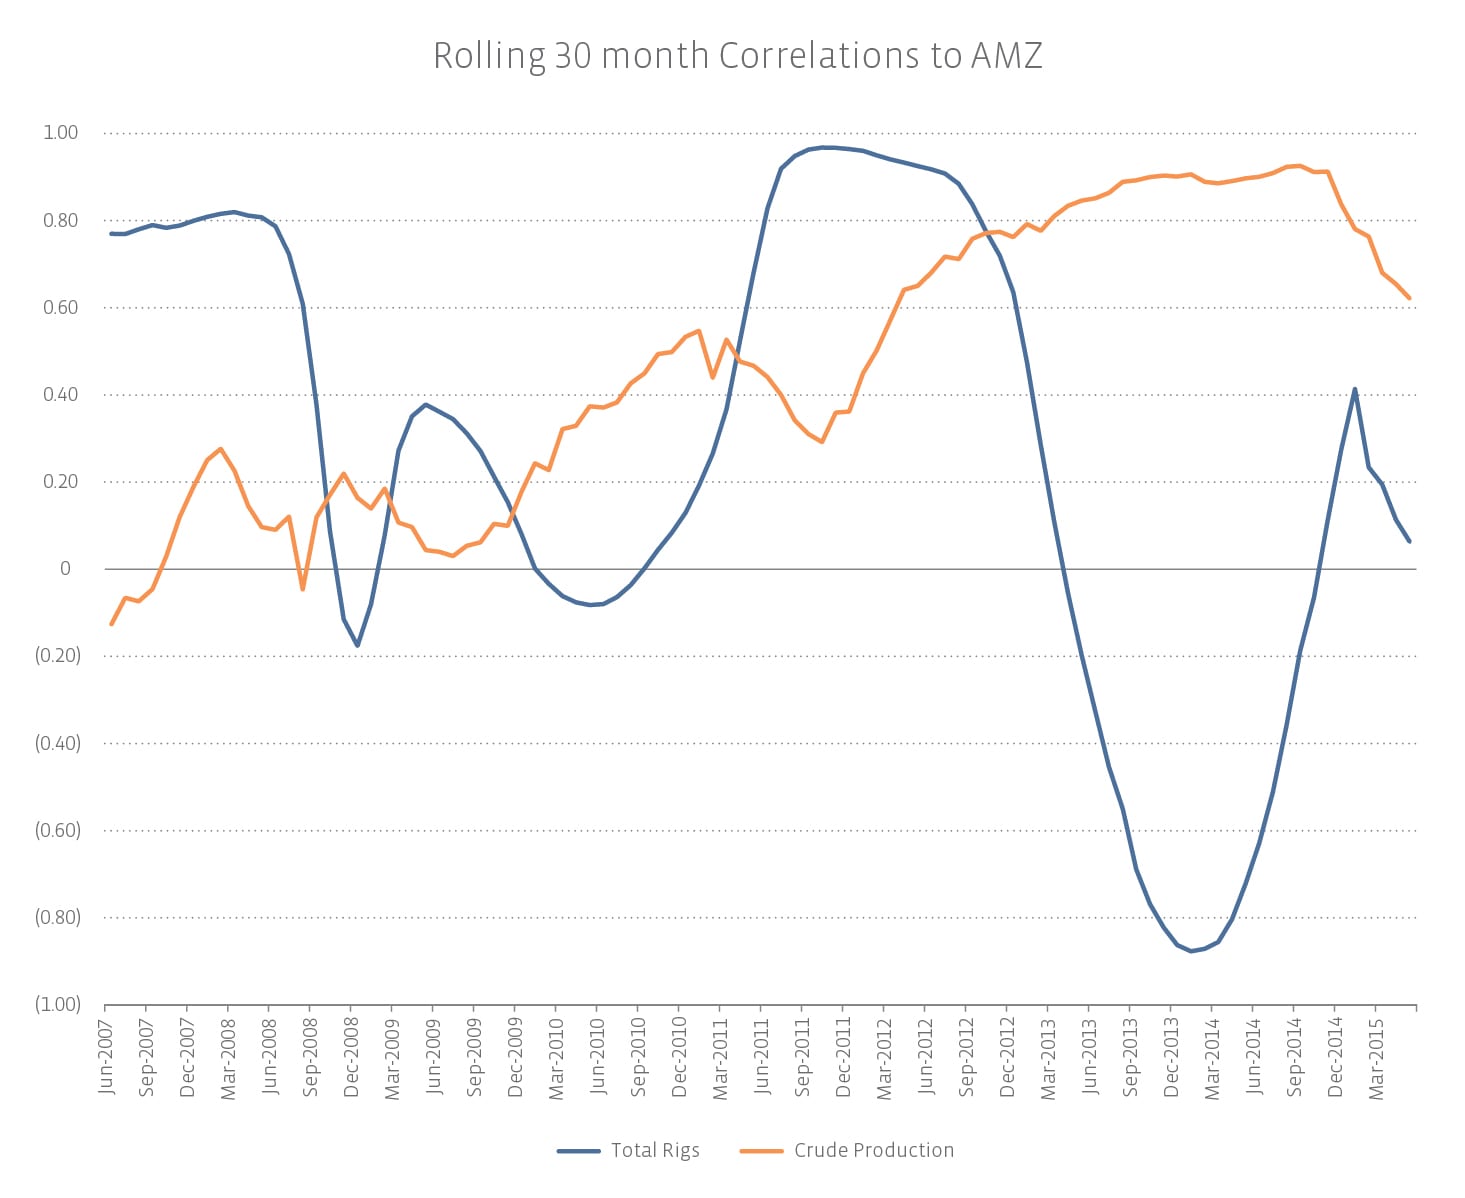
The 0.90 correlation to crude production is actually not indicative of a steady, high correlation, but rather of a generally positive correlation that trended upward through a period of meaningful technological advancement, but has dropped off steadily in the last six months.

More surprising is the extreme fluctuations in rig count correlations. Sometimes, the correlation approaches one; a few years later, it approaches negative one. This volatility makes rig counts an exceptionally poor explainer or predictor of MLP performance.

Crude production could have explained MLP performance before the start of this year, but now, with a correlation of 0.62, it is not a dependable single-factor model.

These days, it seems like everything is volatile and unpredictable: the broader market, Greece, oil, MLPs. It can be hard to find a stable variable on which MLPs depend. Many investors view MLPs as alternative or defensive investments and appreciate that they are not correlated to any one factor. However, one element of MLPs has remained stable: distribution growth. In 2009, in the depths and wake of the financial crisis with capital markets closed, MLPs raised their distributions 2.5%. In 2010, they raised distributions 5.8%; in 2011, 5.6%. 2012: 6.5%. 2013: 6.3%. 2014: 6.3%. For the trailing 12-month period, MLPs raised their distributions 6.1%. One reason for this is that MLPs keep growing organically, as we’ll discuss tomorrow.

Everyone knows that the right thing to do in times of market volatility is to sit tight and stick with the plan, recognize that stocks are on sale, and not make any emotional decisions. Correlations spike close to one for almost all asset classes when the markets panic. But stability in cash flows and distribution growth, the hallmarks of the energy infrastructure sector, remain reliable.

» Popular Pages

  • Tickers
  • Articles

Jun 22

World Markets Watchlist: June 22, 2026

Jun 22

Emerging Markets to Spike as Oil Prices Dip? Try GSEE

Jun 22

Look Beyond Market Euphoria After 3 FCF ETFs Rebalanced

Jun 22

Private Credit Offers Viable Yield Path as Rates Stay Elevated

Jun 22

Franklin Files for Bitcoin-Integrated Dividend ETFs

Jun 22

Managing Exposure to International Equity ETFs Amid UK Political Shifts

Jun 22

Physical AI & Global Reshoring Beyond the Humanoid Hype

Jun 22

VIDEO: ETF of the Week: VFLO

Jun 22

Gaming ETF GAMR Adds Arcade Gaming Giant to Portfolio

Jun 22

Weekly Economic Snapshot: A Hawkish Hold in a High-Stakes Market

QQQ

Invesco QQQ Trust Series I

VOO

Vanguard S&P 500 ETF

GLD

SPDR Gold Shares

PPLT

abrdn Physical Platinum...

SIVR

abrdn Physical Silver Shares...

FOTO

Tuttle Capital Pure Play...

SMH

VanEck Semiconductor ETF

DRAM

Roundhill Memory ETF

SCHD

Schwab US Dividend Equity ETF...

IVV

iShares Core S&P 500 ETF

Loading Articles...

Advertisement

Is Your Portfolio Positioned With Enough Global Exposure?

ETF Education Channel

How to Allocate Commodities in Portfolios

Tom LydonApr 26, 2022
2022-04-26

A long-running debate in asset allocation circles is how much of a portfolio an investor should...

Core Strategies Channel

Why ETFs Experience Limit Up/Down Protections

Karrie GordonMay 13, 2022
2022-05-13

In a digital age where information moves in milliseconds and millions of participants can transact...

}
X