ETFdb Logo
ETFdb Logo
  • ETF Database
  • Channels
    • Themes
      • Active ETF
      • Artificial Intelligence
      • Beyond Basic Beta
      • China Insights
      • Climate Insights
      • Core Strategies
      • Crypto
      • Direct Indexing
      • Disruptive Technology
      • Energy Infrastructure
      • ETF Building Blocks
      • ETF Investing
      • ETF Education
      • ETF Strategist
      • Financial Literacy
      • Fixed Income
      • Free Cash Flow
      • Innovative ETFs
      • Institutional Income Strategies
      • Leveraged & Inverse
      • Managed Futures
      • Market Insights
      • Modern Alpha
      • Multifactor
      • Responsible Investing
      • Retirement Income
      • Tax Efficient Income
    • Asset Class
      • Equity
        • U.S. Equity
        • Int'l Developed
        • Emerging Market Equities
      • Alternatives
        • Commodities
        • Gold/Silver/Critical Minerals
        • Currency
        • Volatility
      • Fixed Income
        • Investment Grade Corporates
        • US Treasuries & TIPS
        • High Yield Corporates
        • Int'l Fixed Income
    • ETF Ecosystem
    • ETFs in Canada
  • Tools
    • ETF Screener
    • ETF Country Exposure Tool
    • ETF Sector Tracker Tool
    • ETF Database Categories
    • Head-To-Head ETF Comparison Tool
    • ETF Stock Exposure Tool
    • ETF Issuer Fund Flows
    • Indexes
    • Mutual Fund To ETF Converter
  • Research
    • ETF Education
    • Equity Investing
    • Dividend ETFs
    • Leveraged ETFs
    • Inverse ETFs
    • Index Education
    • Index Insights
    • Top ETF Sectors
    • Top ETF Issuers
    • Top ETF Industries
  • Webcasts
  • Themes
    • AI ETFs
    • Blockchain ETFs
    • See all Thematic Investing ETF themes
    • ESG Investing
    • Marijuana ETFs
  • Multimedia
    • ETF 360 Video Series
    • ETF of the Week Podcast
    • ETF Prime Podcast
    • Video
  • Company
    • About VettaFi
    • Get VettaFi’ed
  • PRO
    • Pro Content
    • Pro Tools
    • Advanced
    • FAQ
    • Pricing
    • Free Sign Up
    • Login
  1. Index Insights
  2. Williams Does Not Quack Like a Duck
Index Insights
Share

Williams Does Not Quack Like a Duck

Maria HalmoMay 19, 2015
2015-05-19

My mother and I look just like each other. So much so that if you hold up pictures of us when she was seven and I was seven, my father can’t tell us apart. It was true for us at 27, too. And I can only hope that it will still be true when I am 47. But the fact remains, as much as we look like twins born 32 years apart, we are not actually twins. Likewise, my brother is two years younger than I am, but when we were children and he wore his hair long and I had mine short, we were asked if we were twins. The resemblance must be strong, but if you knew us a little better, you’d know that Mike and I are as different as honey and butter.

Similarly, when Williams announced on the morning of its analyst day (slides available here and here) that The Williams Companies (WMB) would be buying Williams Partners (WPZ), the media immediately began commenting on the resemblance between this deal and the one completed by Kinder Morgan (KMI) in November 2014. The comparison to KMI’s purchase of its daughter companies last year is really the closest comp out there. This is only the second time we’ve seen a C Corporation general partner buy its limited partner MLP after all. (Alerian’s original thoughts on the Kinder transaction are available here.)

This is the image alt text


Content continues below advertisement

This is the image alt text

Kinder may be the best comp, but the transaction is different and the effect on tax bills will be different.

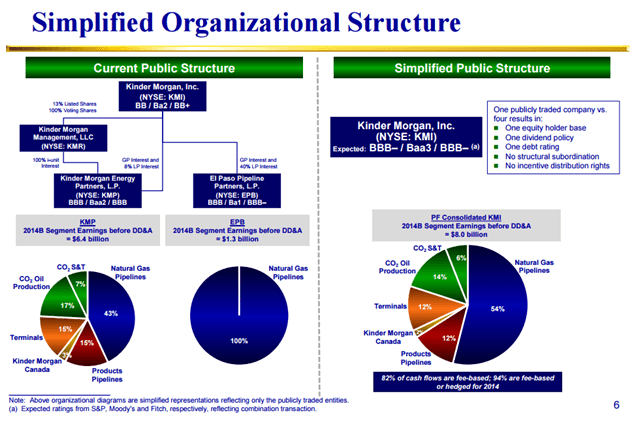
One reason KMI has seen an uplift since the transaction is that MLPs are not eligible for inclusion in the S&P 500. Previous to the deal, KMI had a market cap of $40 billion, when the $44 billion deal was completed, that more than doubled. Suddenly all the SPX-linked assets needed to increase their KMI holdings significantly. WMB is a $36 billion company and also a current member of the S&P 500, but it already owns so much of WPZ that this $13.8 billion deal won’t increase WMB’s S&P 500 weight on the same scale as the Kinder deal, even on a relative basis.

[Note: Due to insider and cross ownership, the math is a little more complicated than KMI more than doubling in size and WMB increasing by a third.

Previous to the Kinder deal, so many KMI shares were owned by directors and executive officers that only 64% of the company was considered public float. (This is according to Alerian’s calculations. S&P may have a slightly different number.) This meant that on a float-adjusted basis, KMI was only a $26 billion company. After the Kinder roll-up, 83% of the company became public, giving it a $70 billion float-adjusted market cap. On a float-adjusted basis, KMI increased by 170%.

For Williams, 88% of the $36 billion company is already public, giving it a $32 billion float-adjusted market cap. Using some back-of-a-napkin math, and foregoing any share price fluctuation, after the deal, WMB will have a float-adjusted market cap of $45 billion, an increase of only around 25%.]

Even looking back, the impetus for the transactions may have been different. Before the Kinder deal, cash flows at both KMP and EPB were steady, but the total cost of capital for the enterprise steadily rose as KMP continued to grow despite reaching the 50% splits in 1997. Also, I’m sure, Rich Kinder was frustrated with KMP trading more or less sideways for the three years preceding the roll-up. For Williams, WPZ (formerly ACMP) had been in the high splits since the end of 2013, which is not nearly so long. Yes, WPZ was dealing with an IDR burden, but with the added complication of a higher beta to oil with the commodity price environment not expected to improve. In February, management reaffirmed WPZ guidance, but they also expected it to be near the low end of the range. The midpoint of the range (based on $55 WTI) meant coverage would be an even 1.0×.

I know we’re an indexing company so everyone assumes we’re all about theoretical constructions, frictionless transactions, and spherical cows. However, just because our theoretical indices don’t pay theoretical distributions (although they have a yield), that doesn’t mean we’re unaware of taxes. Certainly, many KMP and EPB unitholders had a huge unexpected taxable event when they received KMI units. For the Williams transaction, given the merger just last year, even legacy WPZ unitholders from the 2005 IPO wouldn’t have a painfully low cost basis to recapture. At least, not compared to those who owned KMP from its 1992 IPO.

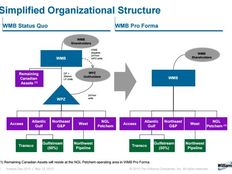
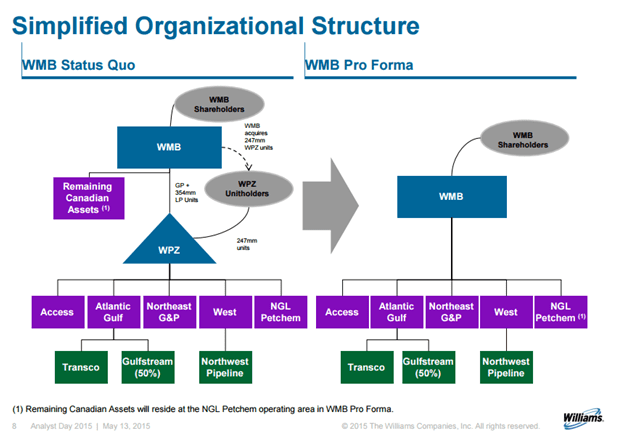
Going forward, WPZ investors will have to decide if they want to stick with the business model they knew before but with a new C Corporation structure (and attendant 1099 tax forms and little if any return of capital). Investors interested in the long-term energy infrastructure build-out of North America, with both WMB and KMI, have another way to access the space. If this method of lowering cost of capital proves popular, more will follow. Previously, GP/LP pairs were grilled about IDR give-backs, IDRs in exchange for units, or the LP buying the GP. Now there will be one more question for investors to ask at the ONEOK Inc (OKE) shareholder meeting today.

It’s easy to get caught up in comparisons, but investors must remember that no two transactions are exactly the same. Despite how it looks, the result of the WMB/WPZ merger will not be a mirror image of the KMI roll-up. As with many things, looks can be deceiving.


» Popular Pages

  • Tickers
  • Articles

Sep 29

A Fixed Income Primer for Constructing Portfolios

Sep 29

Main Management Market Note: September 29, 2023

Sep 29

Higher for Much Longer?

Sep 29

Moving Averages: S&P Ends September Down 4.9%

Sep 29

This Week in ETFs: FormulaFolios Renamed & Adds New Funds

Sep 29

Play Online Car Sales News in These 2 China ETFs

Sep 29

SEC Opens Ethereum Futures ETF Floodgates

Sep 29

VettaFi Voices On: Managing Risk in an Uncertain Economy

Sep 29

SPYI Outperforms SPY in Challenging 3rd Quarter

Sep 29

More Rate Hikes? Watch Treasury ETF USFR

QQQ

Invesco QQQ Trust Series I

SPY

SPDR S&P 500 ETF Trust

VOO

Vanguard S&P 500 ETF

TSLY

YieldMax TSLA Option Income...

VTI

Vanguard Total Stock Market...

TLT

iShares 20+ Year Treasury...

SMH

VanEck Semiconductor ETF

JEPI

JPMorgan Equity Premium...

SCHD

Schwab US Dividend Equity ETF...

XLE

Energy Select Sector SPDR...

Loading Articles...
Our Sites
  • VettaFi
  • Advisor Perspectives
  • ETF Trends
Tools
  • ETF Screener
  • Mutual Fund to ETF Converter
  • Head-To-Head ETF Comparison
  • ETF Country Exposure Tool
  • ETF Stock Exposure Tool
  • ETF Database Pro
More Tools
  • Financial Advisor & RIA Center
Explore ETFs
  • ETF News
  • ETF Category Reports
  • Premium Articles
  • Alphabetical Listing of ETFs
  • Browse ETFs by ETF Database Category
  • Browse ETFs by Index
  • Browse ETFs by Issuer
  • Compare ETFs
Information
  • Contact Us
  • Terms of Use and Privacy Policy
  • © 2023 VettaFi LLC. All rights reserved.

Advertisement

Is Your Portfolio Positioned With Enough Global Exposure?

ETF Education Channel

How to Allocate Commodities in Portfolios

Tom LydonApr 26, 2022
2022-04-26

A long-running debate in asset allocation circles is how much of a portfolio an investor should...

Core Strategies Channel

Why ETFs Experience Limit Up/Down Protections

Karrie GordonMay 13, 2022
2022-05-13

In a digital age where information moves in milliseconds and millions of participants can transact...

}
X