
After a wild swing in the markets it pays to take a step back, review recent leaders and laggards, and recognize whether or not there is a larger sector rotation taking shape.
The premise behind sector rotation analysis is quite straightforward:
1. Review market leaders and laggards leading up to a recent peak.
2. Review how said leaders and laggards held up during said correction.
3. Review post sell-off returns of the former leaders and laggards and look for changes in leadership.
4. Formulate an actionable trading plan to target the next wave of likely leaders and laggards.
Here’s another primer on How to Spot a Sector Rotation.
Let’s dive in!
Dissecting the August Crash
The goal of this particular sector rotation analysis will be to see if there are any meaningful changes in leadership among the nine sectors, listed below, as a result of the steep pullback seen across equity markets in August.
- Cyclical (XLY )
- Technology (XLK )
- Industrial (XLI )
- Materials (XLB )
- Energy (XLE )
- Staples (XLP )
- Health Care (XLV )
- Utilities (XLU )
- Financials (XLF )
Returns and images courtesy of StockCharts.com.
Before the Sell-Off
To establish the baseline leaders and laggards, let’s examine the period spanning the October 15, 2014, lows (the last major correction) through the recent peak that the S&P 500 Index posted on May 20, 2015:
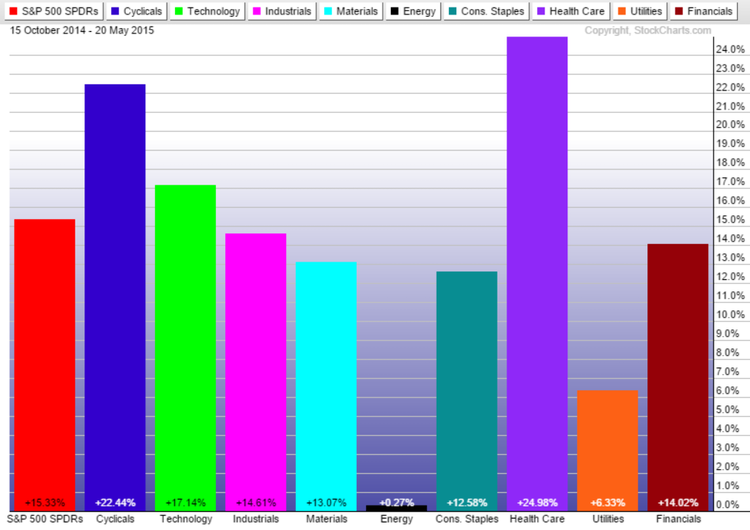
- Cyclicals, tech, and health care were notable market leaders heading into the August sell-off.
- Energy and utilities were notable market laggards heading into the August sell-off.
During the Sell-Off
The sell-off period is defined from the May 20 peak through the August 24, 2015, lows:
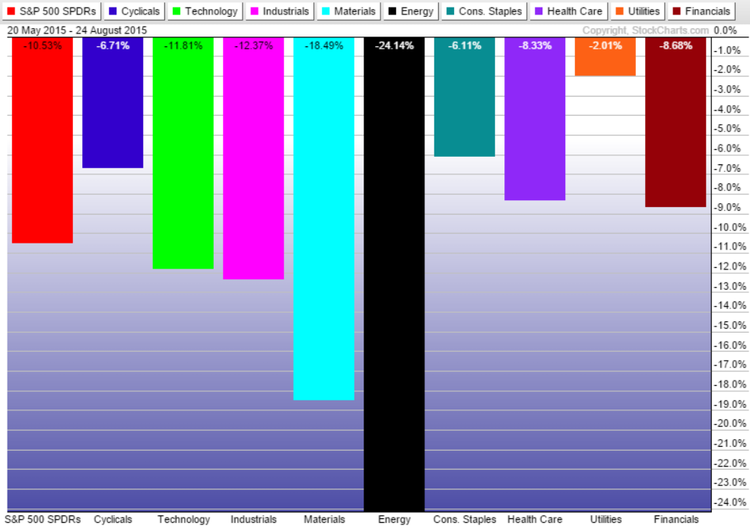
- Materials and energy were big underperformers, likely because the sell-off was China-focused (and the world’s second-largest economy is a major consumer of raw materials).
- Utilities were surprisingly resilient during a market correction that had more than ample talks of “rate hike” fears associated with it.
After the Sell-Off
The rebound period spans the August 24 lows through September 22, 2015:
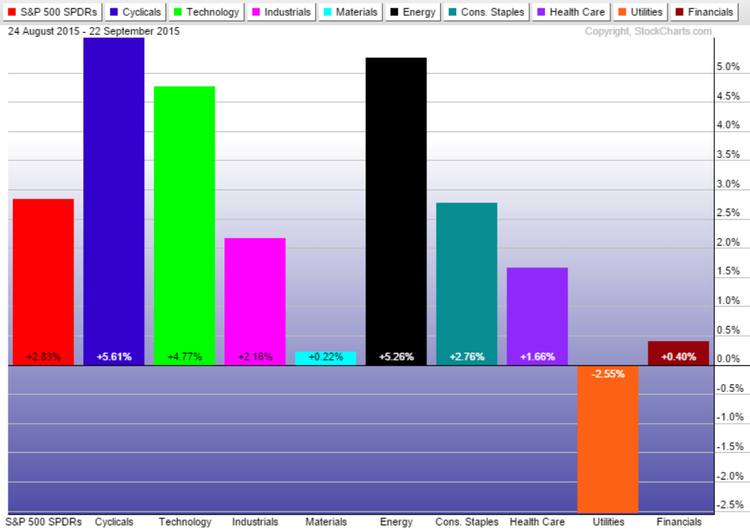
- From the baseline leaders: cyclicals and tech have returned to the front, whereas health care appears to have lost its “leader" status.
- From the baseline laggards: utilities remain serial underperformers as we inevitably head into a rising-rate environment, whereas energy has posted a surprisingly strong rebound after a prolonged stretch of underperformance.
The Bottom Line
For anyone employing a momentum-based trading strategy, it appears that cyclical and tech sector ETFs might be ripe for “buying the dip” opportunities as they continue to demonstrate leadership. Likewise, anyone looking to short ETFs, or utilize inverse products, may wish to sell utilities into any strength. Lastly, it’s too early to tell whether energy is holding up well because it was grossly oversold or because its longer-term trajectory is in fact reversing. Be sure to practice disciplined profit taking and employ a stop-loss with any trading strategy.
Follow me @SBojinov
Image courtesy of Stuart Miles at FreeDigitalPhotos.net

