
ETFdb.com analyzes the search patterns of our visitors each week. By sharing these trends with our readers, we hope to provide insights into what the financial world is concerned about and how to position your portfolio.
This week retail companies have stolen the spotlight by releasing their earnings reports, many of which painted an image of the broad U.S. economy. Emerging markets represented by China equities and Russia have attracted our readers for market-related and geopolitical reasons, respectively. Meanwhile, corn bulls were disappointed after hearing forecasts of a record harvest this autumn, and equity bears are on the lookout for a short opportunity.
Retail: All Eyes on Earnings
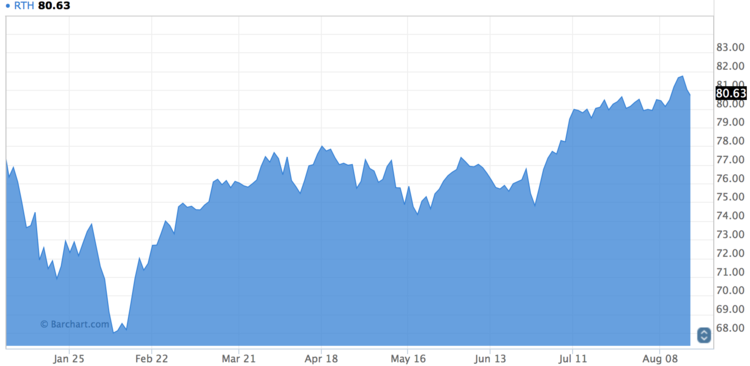
Top U.S. retailers have been reporting their quarterly earnings over the past week, making our readers interested in the ETFs tracking companies such as Wal-Mart Stores (WMT), Home Depot (HD) and Target (TGT). As a result, the retail page has seen its traffic jump 118% week-over-week. While some retailers (i.e., Home Depot) posted good results , others disappointed (Target), contributing to a relatively mixed performance of ETFs. For example, VanEck Vectors Retail ETF (RTH ) has dropped 1% over the past five days, but year-to-date is up 3.74%.
Target released its second-quarter results on Wednesday, saying net income fell 9.7% and sales were down 7.2%. The company lowered its full-year sales guidance, citing a difficult retail environment. The earnings per share results were higher than analysts had expected, but investors were not impressed, bidding the stock down more than 6% on Wednesday. Home Depot, meanwhile, released results on Tuesday that matched forecasts, and the stock has barely moved since then. Wal-Mart is set to issue its quarterly report on Thursday, and expectations are for the company to post good results. Wal-Mart has also been in the news for its recent $3.3 billion acquisition of online retailer Jet.com, prompting pundits to wonder whether the brick-and-mortar giant launched a race after the clear online leader Amazon (AMZN). Other parts of the retail landscape are much grimmer, particularly clothing. Macy’s (M) recently announced plans to close 100 stores in a bid to boost efficiency and reverse flagging sales.
The overall retail landscape looks somewhat healthy. U.S. retail sales increased in the three months through July. The growth was flat for July, however.
China Equities: More Welcoming
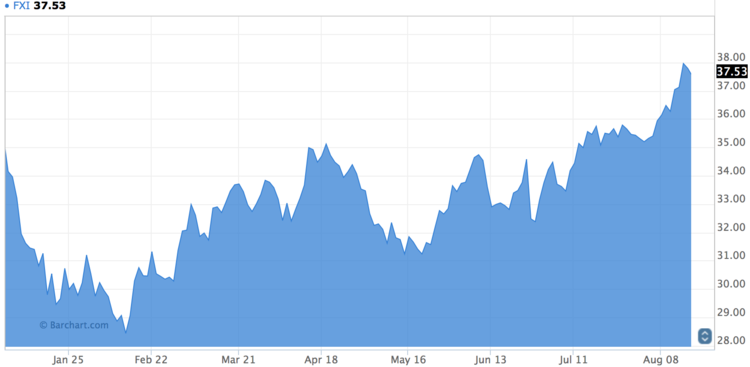
Chinese equities have benefited from good news this week from the government, which announced plans to further open up its stock markets to international investors. Traffic to China equities was up about 91% this week, as investors wondered what to make of the announcement. iShares China Large-Cap (FXI ) has risen 2.26% over the past five days, extending year-to-date gains to 6.35%.
On Wednesday, the Chinese government said it will connect its bourse in Shenzen with the Hong Kong stock exchange, effectively allowing traders of both exchanges to trade each other’s stocks. The move is part of a plan by China to slowly give unrestricted access to international investors willing to invest in the country. Until now, traders were allowed to invest in the country through the Hong Kong-Shanghai connect.
Elsewhere, China announced a fall in new yuan loans to $70 billion in July, prompting market observers to raise eyebrows. A large part of that lending was to finance new home purchases, boosting property developers. Corporate lending, however, remains sluggish.
Russia
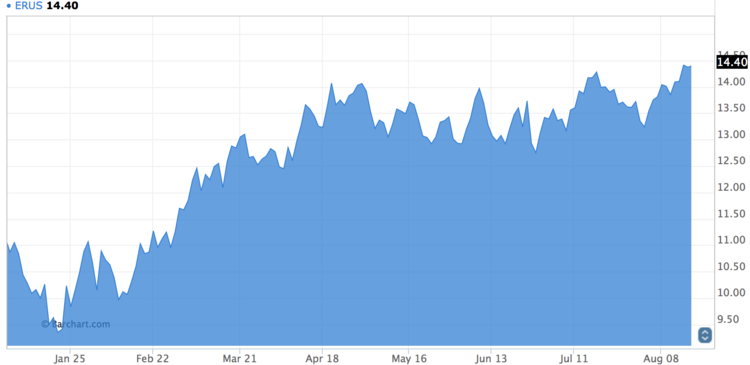
Russian equities have seen their traffic rise more than 60% over the past week, as the country’s relations with the West are deteriorating on renewed tensions over Ukraine. Shares have still edged up slightly over the past week, with iShares MSCI Russia Capped (ERUS ) increasing 1.48%. Year-to-date, iShares MSCI Russia is up an impressive 29.38%.
The good news for equities has been a potential cooperation with Saudi Arabia on freezing oil output to support prices. The sides were close to reaching a deal on stabilizing the market earlier this year, but talks collapsed after Saudi Arabia insisted on Iran joining the accord. The bad news for Russia has been the escalation of the Ukraine conflict. Tensions have been rising since July, and Western allies observed a build-up of Russian forces along the shared border in Crimea. The ruble weakened as a result, and costs to insure Russian debt increased. If tensions escalate and a new armed conflict erupts, Russian equities are expected to decline further on the threat of additional sanctions from Europe and the U.S.
Corn: No Light at the End of the Tunnel
The only ETF tracking corn, Teucrium Corn (CORN ), has jumped slightly over the past few days, although prospects for further gains look grim at the moment. Corn has seen 54% more viewers this week than in the past, as investors were disappointed to acknowledge that a recovery in prices may not come anytime soon. The U.S. Agriculture Department said last Friday that the country was on track to harvest record amounts of corn this autumn, about 15.2 billion bushels of compared to the previous record of 14.2 billion achieved in 2014. Higher demand is not expected to offset the increase in supply, putting further pressure on prices.
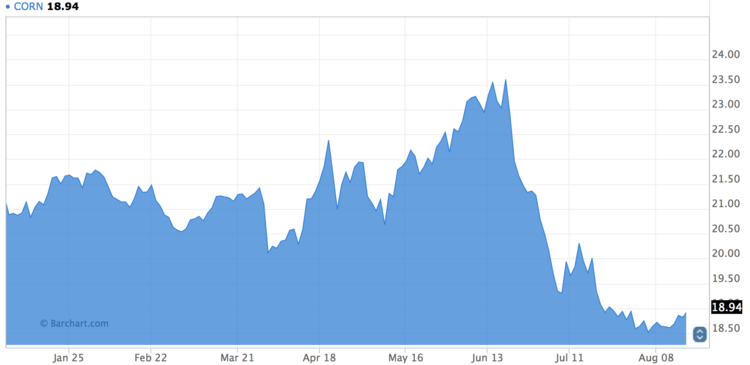
Teucrium Corn has risen 1.77% over the past five days, but is still down 10.74% since the beginning of the year.
Inverse Equities: Waiting to Short
Inverse Equities ETFs have taken the last spot in the list with a 34% rise in viewership over the past week. The ETFs gaining from a slide in stock prices have had a bad year so far, given the U.S. equities are hovering around all-time highs. For instance, Short S&P500 (SH ) has dropped 0.71% this week, extending year-to-date losses to nearly 9%.
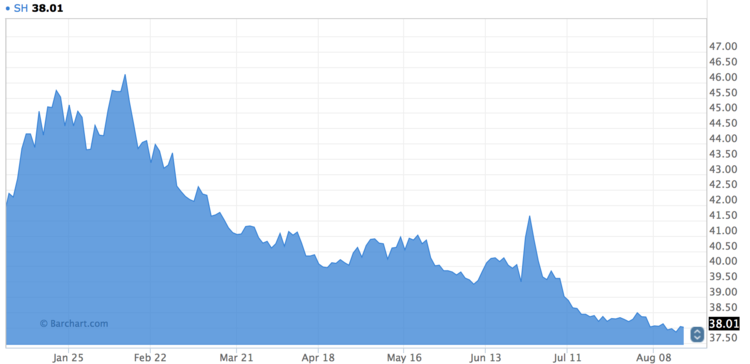
Despite the obvious optimism in the market, many reputable voices have condemned this bull run, pointing to fundamental weaknesses and sluggish economic growth both in the U.S. and the rest of the world. Perhaps, the U.S. stocks are becoming more attractive for a short position as the bull market continues its advance.
The Bottom Line
Retail companies have posted mixed results for the second quarter, with apparel struggling the most and online in high gear. Chinese stocks have been boosted by news of a connection between the Hong Kong and Shenzen bourses, while Russian equities could suffer from the resuming of the Ukraine conflict. Corn, which took fourth place in the list, is not likely to see a rebound in prices anytime soon given the record crop forecasts, and inverse equities drew interest for the short-selling possibility.
By analyzing how you, our valued readers, search our property each week, we hope to uncover important trends that will help you understand how the market is behaving so you can fine-tune your investment strategy. At the end of the week, we’ll share these trends, giving you better insight into the relevant market events that will allow you to make more valuable decisions for your portfolio.

