
A closely followed measure of stock market volatility surged this week reaching its highest level since the Brexit crisis, as US rate-hike fears stoked a fresh selloff on Wall Street. The Chicago Board Options Exchange (CBOE) Volatility Index, investors’ preferred measure of market uncertainty, spiked nearly 40% on Friday. By Wednesday, the so-called ‘fear index’ was trading at 18.14 on a scale where 20 represents the historical average.
Inverse Volatility: The Unlikely Winner
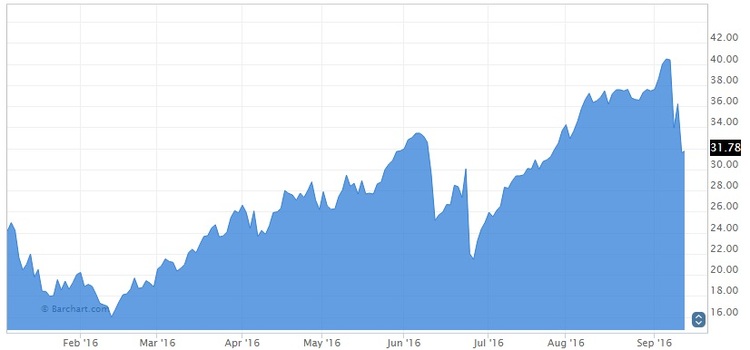
For all the talk of volatility, inverse volatility products like the VelocityShares VIX Short-Term ETN (XIV ) were the leaders this week, with overall traffic surging nearly 272%. Exchange-traded funds with inverse exposure to the CBOE VIX experienced positive returns Monday when volatility declined 13.4%.
Volatility returned to Wall Street last week after Boston Federal Reserve President Eric Rosengren argued in favor of gradual rate increases. Rosengren, who is also a member of the Federal Open Market Committee (FOMC), said there were significant risks with delaying future rate hikes.
“A failure to continue on the path of gradual removal of accommodation could shorten, rather than lengthen, the duration of this recovery,” Rosengren said in prepared remarks in Quincy, Massachusetts last Friday.
Rosengren’s comments helped trigger the biggest selloff on Wall Street since Britain voted to leave the European Union on June 23. By the end of the day, the S&P 500 was down 2.5%, and the Dow Jones had plunged nearly 400 points. The selloff would continue on Tuesday, leading to another sharp rise in the VIX.
Prior to the latest equities selloff, XIV was trading at its highest level of the year. By Wednesday, it had fallen 21.5% to a fresh seven-week low.
Leveraged Volatility Provides Ample Reward as Market Turmoil Resumes
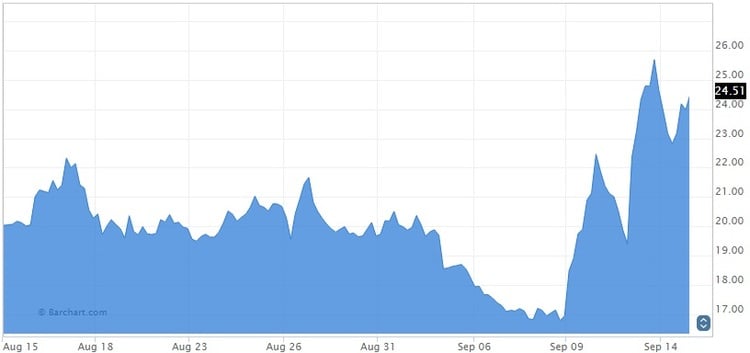
It comes as no surprise that ETFs with long positions on the VIX saw their viewership surge last week. Traffic for leveraged-volatility products spiked 184.1%, as investors nervously watched equity markets tumble. The ProShares Ultra VIX Short-Term Futures ETF (UVXY ), which is designed to deliver 2X leveraged returns of the S&P 500 VIX Short-Term Futures Index, gained 45% over the past week.
Volatility ETFs achieved record volumes this week. On Tuesday, the iPath VIX Short-Term Futures ETN recorded more volume than any company listed on the S&P 500, with a total of 110 million shares changing hands. Clearly, volatility was in the spotlight after Friday’s massive selloff. The market is expected to remain skittish ahead of the Federal Reserve’s upcoming policy meeting to be held September 20-21. The official rate statement will be accompanied by a revised summary of economic projections covering GDP, inflation and unemployment. The Fed’s now infamous “dot-plot” chart of interest rate expectations will also be included in the projections.
US Government Bonds Hit Hard by Central Bank Worries
The recent equities selloff put the spotlight back on government bonds. Inverse bonds benefited from the exposure, with viewership rising 177.2% over the past week. Concerns that central banks are losing their appetite for monetary easing kicked off the government bond selloff last week, after the European Central Bank failed to extend its quantitative easing program beyond March 2017.
Investors are also speculating that the Bank of Japan will make negative interest rates the centrepiece of its future stimulus campaigns, a sign that quantitative easing has run its course. Policymakers on Wednesday will be tasked with convincing investors that the Bank is still on track to achieve its 2% inflation target, which will be a tough sell following five consecutive months of deflation.
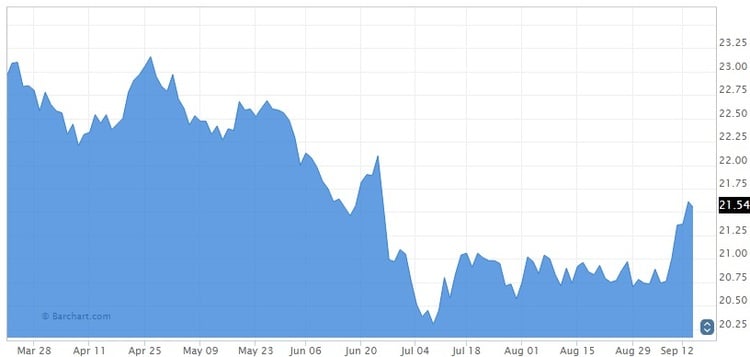
US government bonds were at the centre of the financial storm that erupted last week, creating favorable conditions for inverse bonds ETFs that provide exposure to popular fixed income benchmarks. As yields on Treasury bonds declined, inverse ETFs like the Short 20+ Year Treasury Yield ETF (TBF ) surged. TBF advanced 3.5% on the week, reaching a fresh 12-week high on Tuesday.
Higher Volatility Bad News for US Equities
With volatility spiking, inverse equities ETFs saw a 92.1% increase in traffic this week. Researchers have identified a predictable inverse relationship between the VIX and the S&P 500, as these two assets move in the opposite direction about three-quarters of the time.
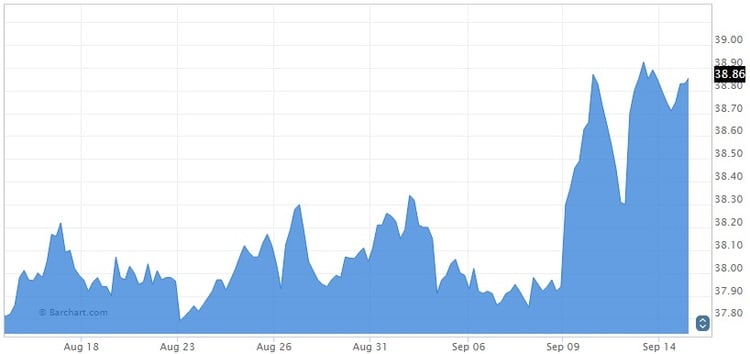
With volatility reaching 11-week highs, the S&P 500 quickly found itself in the doldrums, as the combination of rate-hike bets, geopolitics and weak oil prices created dismal conditions for riskier asset classes. By Wednesday’s close, the large-cap index was trading at more than two-month lows. Conversely, the ProShares Short S&P 500 ETF (SH ) reached more than two-month highs, closing at 38.86 on Wednesday.
Semiconductors, Tech Funds Finish Ahead of the Broader Market
With a 50.8% increase in traffic, semiconductors takes fifth place on our list. While no sector emerged unscathed after the latest equities selloff, a few components finished ahead of the broader market. The SPDR S&P Semiconductor ETF (XSD ), a component of the information technology sector, closed down 1.9% this week. By comparison, the broader S&P 500 Index posted declines of 2.6%.
The XSD rallied 0.8% on Wednesday, slightly ahead of the broader tech industry. The S&P 500 continued its descent Wednesday, closing down 0.1%.
Semiconductors have been a source of stability for Wall Street, having gained more than 15% year-to-date.
The Bottom Line
Volatility made a big return to the financial markets this week, signaling that the prolonged period of complacency may be coming to an end. As the VIX continues to approach 20, equities will be especially vulnerable to larger pullbacks. However, the VIX would require a sustained push above 20-25 to signify a major trend reversal for the S&P 500.

