Italy voted in its next leadership this past week and the results are not encouraging, with the Eurosceptic party Five Star Movement (M5S) emerging as the winner.
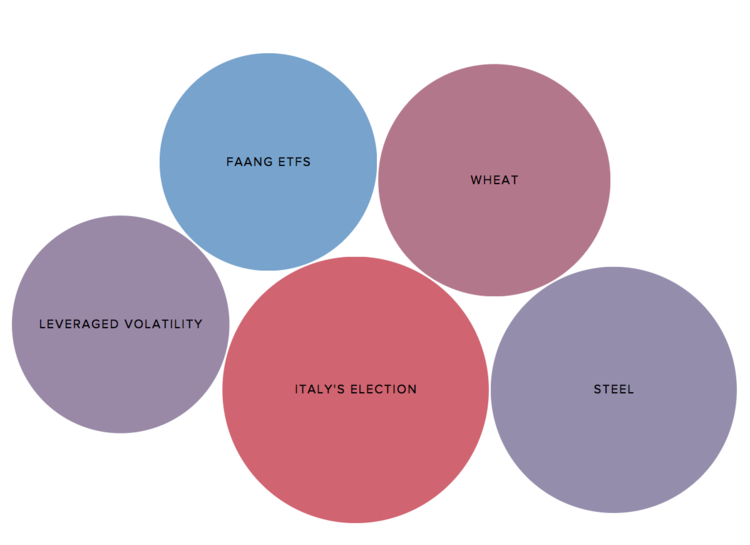
Across the Atlantic, U.S. President Donald Trump is risking a trade war after signaling his intent to slap tariffs on imports of steel and aluminum. As such, Italy and steel ETFs took the first two spots in the list and were followed by wheat ETFs, FAANG stocks and leveraged volatility ETFs.
Check out our previous trends edition at Trending: Return of Volatility Signals More Turbulence Ahead.
Italy’s Election Points to an Uncertain Future
Italy’s Movimento 5 Stelle won the election in Italy but the Eurosceptic party led by former comedian Beppe Grillo will have to form a coalition if it wants to govern. Italy ETFs have seen their viewership rise as much as 719% in the past five days.
The ruling establishment party PD came in second with 19% of the votes, around 12 percentage points less than the winner. Anti-immigration party Lega Nord and Silvio Berlusconi’s Forza Italia, which formed a coalition with other smaller parties, collectively garnered 37% of the votes.
Following the results, both the Lega Nord-led coalition and M5S proclaimed the right to govern. M5S, which put forward 31-year old Luigi di Maio as its leader because Grillo cannot become Prime Minister due to a manslaughter conviction in the 1990s, ruled out a coalition with Lega Nord’s center-left, although both sides signaled a willingness to kick off discussions. This situation forces both M5S and the center left to attract Matter Renzi’s PD on their side to govern. Renzi stepped down following the disastrous results amid disagreement over the party’s standing in the upcoming negotiations to form a government. Renzi apparently favored a move into opposition, while some of his rebel colleagues are said to be open to a deal with M5S or forming a grand center-left coalition.
M5S and Lega are both anti-establishment parties favoring a shakeup of the European Union or an outright exit. Lega’s Matteo Salvini said a referendum on the euro was not a possibility, but the euro currency project is flawed and may need to change. M5S was also critical of the European Union but under di Maio it has softened its stance.
If a deal is not reached, then President Sergio Mattarella will leave the current government in place.
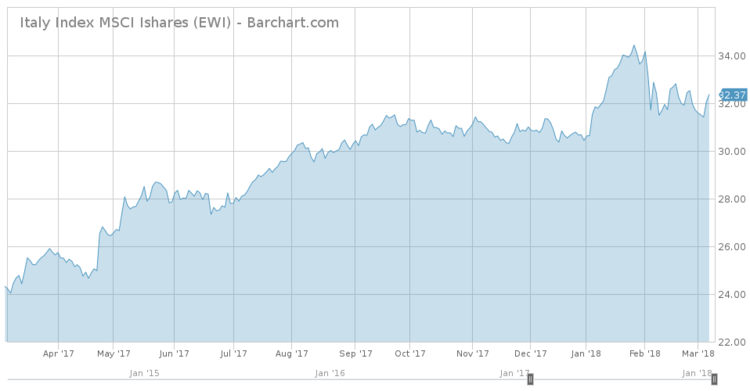
iShares MSCI Italy (EWI ), the ETF tracking the performance of the Italian stock market, has posted flat gains over the past five days. In the past 12 months, (EWI ) has advanced 30%.
Trump’s Steel Gambit Risks Trading War
U.S. President Donald Trump has taken the markets by surprise after he announced plans to impose tariffs on imports of steel and aluminum, potentially triggering a trade war with its partners. As a result, traffic to steel ETFs has surged 218% in the past five days. Trump is on track to impose a 25% import tax on steel and 10% on aluminum to purportedly preserve U.S. national security. The move drew condemnation not only from Democrats but also from fellow Republicans, with Speaker Paul Ryan urging Trump to back down. Gary Cohn, Trump’s chief economic advisor, resigned from his role after disagreeing with Trump’s action.
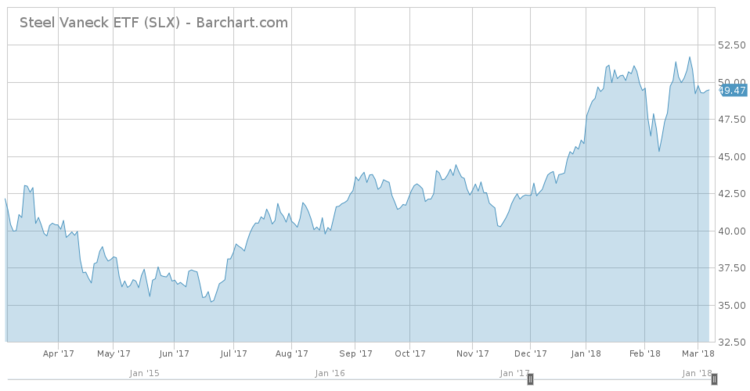
Investors have not approved of the move, sending the broad market, including steelmakers, down abruptly. For instance, VanEck Vectors Steel (SLX ) has dropped 0.6% over the past five days, although it remains up 7.9% since the start of the year.
The broad market moved sideways as investors gauge the possibility of a tit-for-tat trade war that will lead to lower output across the board. Indeed, the European Union, which exports most of its steel to the U.S., already indicated plans to impose tariffs on $3.5 billion worth of U.S. goods, including motorcycles, whisky and t-shirts. In turn, Trump warned that he will slap import taxes on European cars. The U.S. leader also gave the market some reasons for optimism, saying the negotiation of a “fair” deal with NAFTA will prevent the implementation of import levies.
Sign up for ETFdb.com Pro and get access to real-time ratings on over 1,900 U.S.-listed ETFs.
Wheat ETFs Surging on Dry Weather
Wheat ETFs took the third position in the trends’ list with a 168% rise in viewership, as the agricultural commodity was a rare bright spot in a weak market. Teucrium Wheat ETF (WEAT ) has increased 5.5% in the past 30 days, extending year-to-date gains to as much as 13%. The reason for the rise is the lack of wet weather across the U.S. and excessively low temperatures in Europe and Russia.
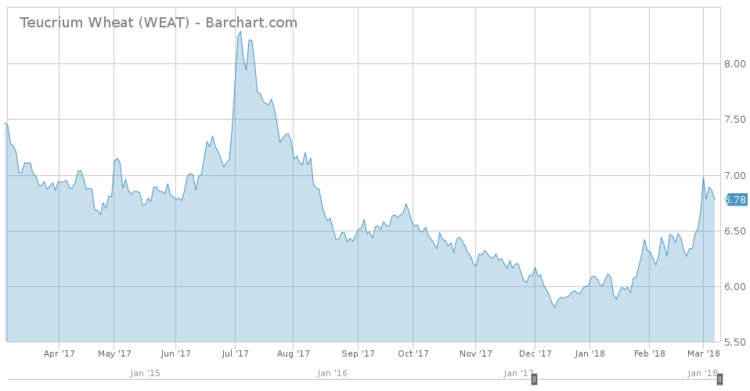
As such, the quality of crops in the U.S. is expected to be substandard, with a Monday report indicating that zero percent of Oklahoma’s winter crop was in excellent condition and only 4% was good-to-excellent. Kansas, the U.S.’ largest producer of wheat, reported 12% of good-to-excellent crop, down 2 percentage points compared to the previous forecasts.
This all means good news for wheat, which has performed abysmally in the past five years. Despite the advances in 2018, (WEAT ) remains 63% down in the past five years.
For a deeper analysis on individual ETF investments such as (WEAT ) or (SLX ), use our ETF Analyzer tool. You can select ETFs by category or type as well as add individual ticker symbols to compare performance, expenses and dividend yield, among other metrics.
FAANG ETFs
FAANG ETFs have seen their traffic advance 155% this week, as the largest technology stocks outperformed the broader market. PowerShares QQQ (QQQ ) has risen 3.6% in the past five days, while the broad market (SPY ) was up just 2.4%. Year-to-date, the performance differential was even bigger, with (QQQ ) surging 6.6% and (SPY ) 1.15%.
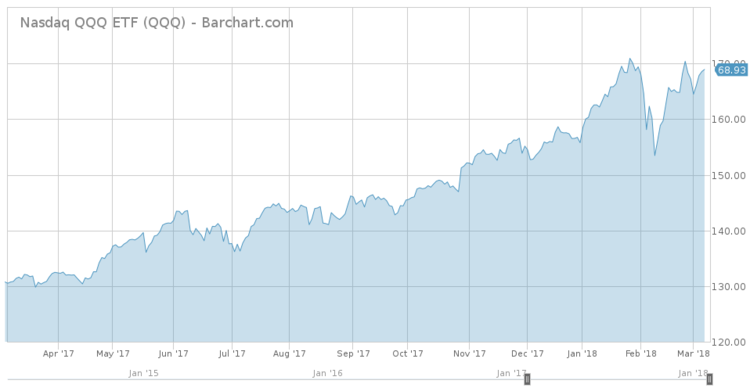
Not all FAANG stocks performed equally well, though. Netflix (NFLX) and Amazon (AMZN) were by far the best performers from the pack, rising 56% and 28%, respectively, since the start of the year on solid financial results. Facebook, meanwhile, has dropped 0.5% year-to-date largely due to an announcement that the company would focus its newsfeed on content generated by the closest persons instead of commercial users. Alphabet (GOOG) has posted modest gains of 2.15%, while Apple (AAPL) rose 1.6% as sales of its flagship product iPhone X came in below expectations.
Leveraged Volatility
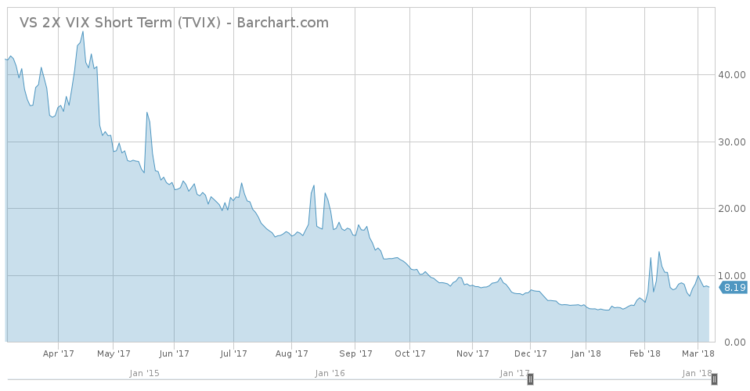
Leveraged Volatility ETFs have been trending of late because they grabbed the headlines in the most recent market rout. As a result, traffic to these ETFs saw a spike of 87% this week. Credit Suisse was forced to close down an exchange-traded note tracking inverse volatility after investors betting on the lack of it suffered heavy losses. As there are increasingly bigger signs that a trade war between the U.S. and other countries is possible, volatility in the stock markets may be here to stay.
VelocityShares Daily 2x VIX Short Term (TVIX ) is up nearly 47% this year, although its performance for the last two years remains horrible, down 99.4%.
The Bottom Line
Elections in Italy failed to identify a clear winner and now three parties would have to seek a compromise and form a government – or else risk new elections. What was clear, though, is that anti-establishment parties have gained further ground. Across the Atlantic, President Trump unnerved markets and U.S. trading partners after announcing plans to impose tariffs on aluminum and steel. Wheat ETFs have been on a tear lately thanks to forecasts of dry weather and bad crops, although its long-term performance remains weak. FAANG ETFs outperformed as a group but their individual performance is highly disparate. Finally, volatility ETFs may experience higher demand as a potential trading war risks sparking more volatility ahead.
By analyzing how you, our valued readers, search our property each week, we hope to uncover important trends that will help you understand how the market is behaving so you can fine-tune your investment strategy. At the end of the week, we’ll share these trends, giving you better insight into the relevant market events that will allow you to make more valuable decisions for your portfolio.

