
Major ETF provider Vanguard surprised the markets this week with a decision to eliminate trading fees for a majority of ETFs on its online brokerage platform.
Vanguard is at the top of the list this week followed by China, whose stock market has suffered from an ongoing trade spat with the U.S. Crude oil is third on the list as Saudi Arabia is gradually hiking supplies, while high-yield bonds and technology ETFs close the list.
Check out our previous trends edition at Trending: Strong U.S. Dollar Weighs on Gold Despite Trade Woes
Vanguard First to Cut Trading Fees on Majority of ETFs
Vanguard, one of the biggest ETF provider in the space, is eliminating trading fees on a majority of the ETFs on its trading platform, launching a first salvo in the battle with other passive asset managers. Vanguard has seen its traffic rise as much as 1050%
Around 1,800 ETFs on the company’s brokerage platform will be traded commission-free, including Vanguard and BlackRock’s iShares ETFs. The provider decided to exclude around 200 inverse and leveraged ETFs from the program due to their speculative characteristics. Vanguard said its goal is to encourage asset appreciation over the long term.
The move was made with the purpose of attracting cost-conscious clients and then trying to sell them different services on the platform. Millennials are believed to value the absence of trading commissions and may be switching their accounts to Vanguard as a result.
Whether other providers will follow suit remains an open question. Some brokerage firms, including E*Trade Financial and Ameritrade, already provide commission-free trading on some ETFs, but none have as many as Vanguard.
For investors, Vanguard’s move is a double-edged sword. On on hand, investors will save money from lower commissions, but unfettered trading may lead to an increase in volatility and lower returns.
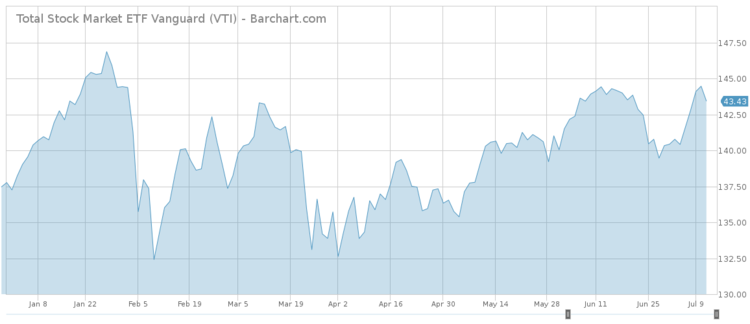
Vanguard has some of the largest ETFs in the world by assets under management. Vanguard Total Stock Market (VTI ), the third-largest ETF, has $100 billion in total assets, while Vanguard S&P 500 (VOO ) has $93 billion and is the fourth largest.
Sign up for ETFdb.com Pro and get access to real-time ratings on over 1,900 U.S.-listed ETFs.
China Stocks Drop as Trade War Escalates
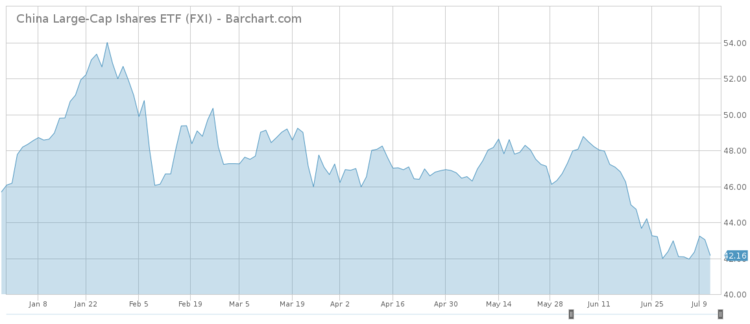
Chinese stocks have been on a wild ride of late, as investors are reassessing the possibility of a full-blown trade war. China has taken the second place in the list with a 222% rise in viewership. iShares China Large-Cap ETF (FXI ) has swooned more than 12% in the past 30 days and moved sideways in the past five trading days.
The U.S. has already imposed levies on $30 billion worth of Chinese imports, in addition to previous tariffs on aluminum and steel. In a move that further shocked China, the Trump administration said it is preparing to slap a 10% tariff on additional $200 billion worth of Chinese imports. If the U.S. delivers on its threats, the total value of targeted imports would surge to $450 billion, close to the $505 billion goods China is sending to the U.S. annually.
The tariffs have seemingly rattled not only the Chinese markets and the renminbi but also global markets, particularly those with high exposure to China. Semiconductor ETFs have been particularly hit, with ProShares Ultra Semiconductors (USD ) falling 11% in the past 30 days.
The new round of levies has drawn condemnation from some American officials who had supported previous tariffs. Senate Finance Committee Chairman Orrin Hatch said the move seemed “reckless,” adding he favored the start of negotiations on a bilateral trade deal that is “fair.”
Use our Head-to-Head Comparison tool to compare two ETFs such as (USD ) and (VTI ) on a variety of criteria such as performance, AUM, trading volume and expenses.
Crude Oil
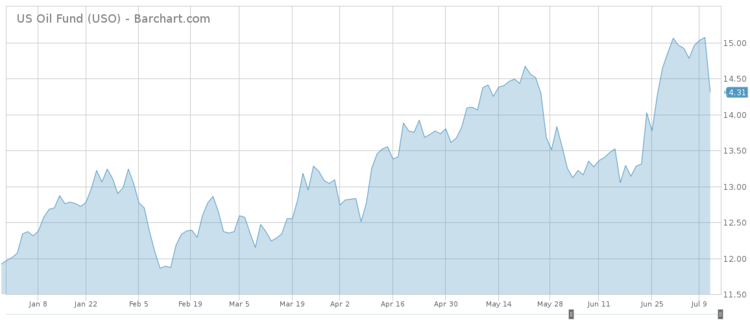
Crude oil had been set for a strong week, but Wednesday’s news of a hike in supply from Saudi Arabia sent the black commodity down. United States Oil Fund (USO ) fell 2.4% on Wednesday, bringing weekly gains into negative territory. (USO ), which saw its traffic rise as much as 158% in the past five days, remains up more than 12% for the rolling month.
Saudi Arabia increased output by 500,000 barrels per day in June, bringing output at 10.5 million barrels per day, while supply from the OPEC nations was up by 173,000 barrels. The oil cartel agreed in May to hike supplies to tame an upsurge in oil prices and keep markets well supplied. The hike was expected to start in July, but apparently, Saudi Arabia and other oil-producing countries thought it was best to proceed with the increase earlier.
For a deeper analysis on individual ETF investments such as (USO ) or (VOO ), use our ETF Analyzer Tool. You can select ETFs by Category or Type as well as add individual ticker symbols to compare performance, expenses and dividend yield, among other metrics.
The undersupply stems from an agreement between Russia and OPEC in early 2016 to reduce output aimed at clearing an ongoing glut that had sent oil prices near record lows. However, countries such as Venezuela have seen their output drop, which, combined with the agreed cuts and strong demand, led to a shortfall.
Saudi Arabia also predicted that global demand will rise above 100 million barrels per day for the first time in history. The forecast is contingent on the lack of major trade shocks, such as an ongoing spat between the U.S. and China on trade, which may have a negative impact on confidence.
High-Yield Bonds
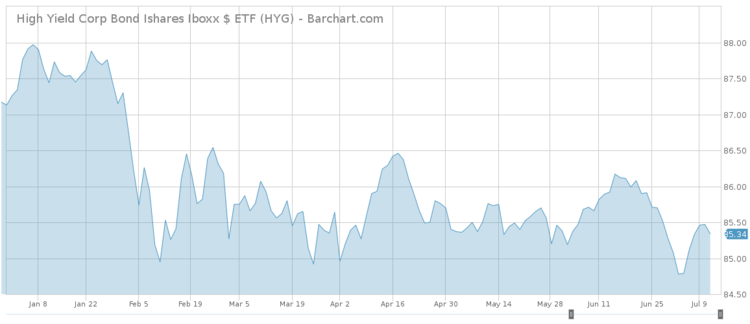
High-yield bonds have taken the fourth spot on the list this week with a rise in viewership of 154%, as the asset class performed unusually well despite worrying macroeconomic trends. iShares iBoxx $ High Yield Corp Bd (HYG ) has risen 0.7% in the past five days, a big move for bonds, but remains down more than 2% since the start of the year.
High-yield bonds are closely linked to the health of the economy and the level of interest rates. Rising rates, for instance, may lead to an increase in defaults as issuers may find it hard to finance debt. Meanwhile, slowing economic growth hits companies’ cash flows, again impacting their ability to service their obligations.
Surging interest rates combined with an escalation in the trade war between the U.S. and China may lead to subdued economic activity. High-yield issuers may withstand such a shock, as their overall debt is now below peak levels in 2016.
Technology Stocks
Technology stocks have recouped most of the losses experienced during the past month and continue to plow ahead. The asset has seen its traffic rise 151% this week, not far behind high-yield bonds.
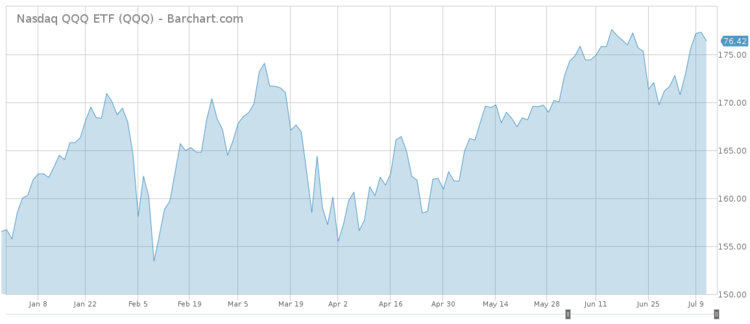
Invesco (QQQ ), the main technology ETF mimicking the performance of Nasdaq, has surged more than 3% this week, extending year-to-date gains to as much as 13%. Some market observers raised the alarm that a large part of the gains were attributable to just five stocks: Amazon (AMZN), Netflix (NFLX), Microsoft (MSFT), Apple (AAPL) and Facebook.
Soothing such concerns, previous bull markets acted similarly, with some studies claiming that 4% of the stocks were responsible for 70% of the gains.
For more ETF news and analysis, subscribe to our free newsletter.
The Bottom Line
Major ETF provider Vanguard was the first brokerage to eliminate trading fees on a majority of ETFs, throwing the ball into the courts of its rivals, including BlackRock and Charles Schwab. Chinese stocks have posted abysmal performance of late as a trade war with the U.S. escalated. Crude oil reversed some gains this week after OPEC started to pump more oil in June, while high-yield bonds proved resilient in the face of uncertainty. The technology sector’s performance raised worries that the gains were driven by a handful of stocks.
By analyzing how you, our valued readers, search our property each week, we hope to uncover important trends that will help you understand how the market is behaving so you can fine-tune your investment strategy. At the end of the week, we’ll share these trends, giving you better insight into the relevant market events that will allow you to make more valuable decisions for your portfolio.

