
To help investors keep up with the markets, we present our ETF Scorecard. The Scorecard takes a step back and looks at how various asset classes across the globe are performing. The weekly performance is from last Thursday’s open to this week’s Wednesday close.
- Trade talks between China and the United States are set to resume later this month, White House Economic Adviser Larry Kudlow confirmed on Thursday. Although negotiations are expected to be low-level, China’s envoy to Washington will be looking for pathways to resolve a lingering trade dispute that threatens to disrupt domestic growth.
- A trio of Chinese reports this week added to growing fears of a slowing economy. Industrial production, retail sales and fixed-asset investment all grew less than expected in July.
- On the domestic data front, U.S. retail sales grew faster than expected in July, a sign that consumer spending was fueling economic growth.
- A measure of implied volatility known as the CBOE VIX rose on Wednesday to its highest level in six weeks, a sign that complacency on Wall Street was eroding in the face of economic and political risks.
- Crude oil plumbed to two-month lows this week after U.S. government data showed a large and unexpected surge in weekly crude inventories.
- The Turkish lira recovered from record lows this week after Qatar pledged to shore-up the nation’s fragile banking system. The USD/TRY exchange rate referenced in the global currency market plunged more than 15% between Monday and Wednesday.
- Shares of WalMart (WMT) surged more than 9% on Thursday after reporting stellar earnings for the most recent quarter. The retail giant also said it expects U.S. e-commerce sales to rise 40% for the full year.
- The eurozone economy expanded faster than expected in the second quarter, revised data showed on Tuesday, although that wasn’t enough to stop the euro’s freefall. The common currency touched fresh 13-month lows as the dollar continues to assert its dominance.
Risk Appetite Review
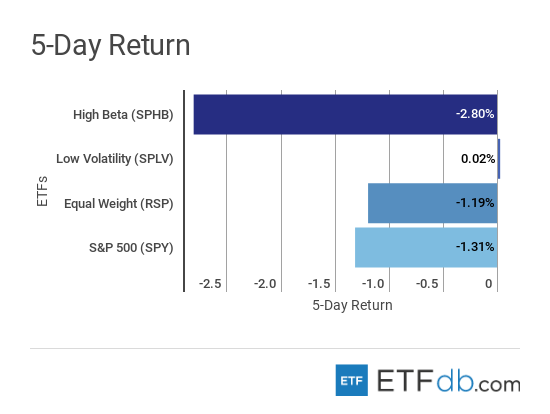
- Stocks were down sharply through the first half of the week, as volatility returned to Wall Street.
- Between Monday and Wednesday, the broad market (SPY ) declined 1.31%, although it put up a strong rebound in Thursday’s session.
- S&P 500 Low Volatility ETF (SPLV ) was the best performer from a risk perspective. It traded virtually flat over the five-day stretch.
Sign up for ETFdb.com Pro and get access to real-time ratings on over 1,900 U.S.-listed ETFs.
Major Index Review
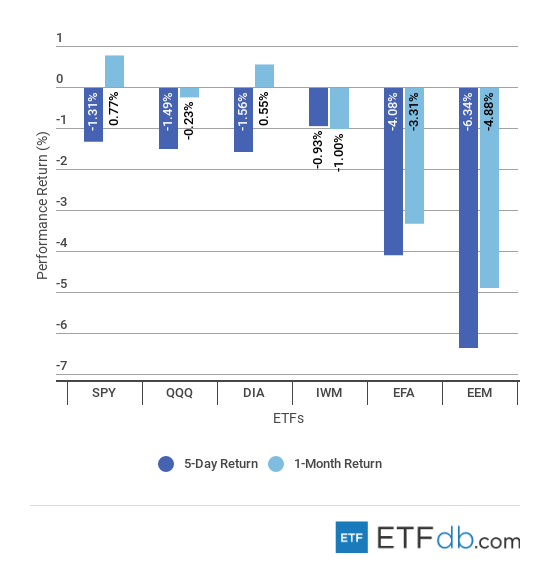
- All major indexes were down sharply.
- Turkey’s generational crisis triggered a sharp sell-off in emerging markets (EEM ) this week, declining 6.34%.
- Large- and mid-cap companies in developed markets (EFA ) also declined sharply this week, posting losses of 4.08%.
- For the rolling month, the large-cap S&P 500 Index (SPY ) was the best performer, gaining a mere 0.77%.
To see how these indices performed a week before last, check out ETF Scorecard: August 10 Edition.
Sectors Review
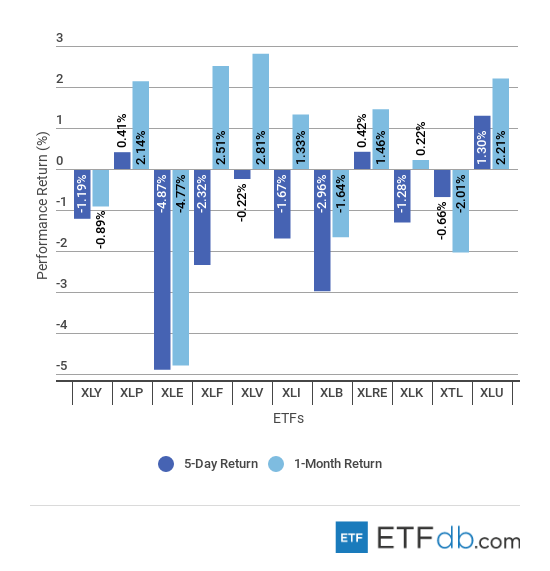
- A majority of the S&P 500’s 11 major indexes finished lower during the five-day stretch, with energy (XLE ) leading the declines. The sector fell 4.87% as oil prices sold off.
- Sectors tied to commodities, such as materials (XLB ), also declined sharply.
- Losses extended far beyond primary industry, with financials (XLF ) falling 2.32%.
- On the positive side of the spectrum, utilities (XLU ) rose 1.30% and consumer staples (XLP ) added 0.41% this week.
- On a rolling monthly basis, seven out of 11 primary sectors reported gains, with healthcare (XLV ) and financials leading the way.
Use our Head-to-Head Comparison tool to compare two ETFs such as XLB and XLF on a variety of criteria such as performance, AUM, trading volume and expenses.
Foreign Equity Review
To find out more about ETFs exposed to particular countries, use our ETF Country Exposure tool. Select a particular country from a world map and get a list of all ETFs tracking your pick.
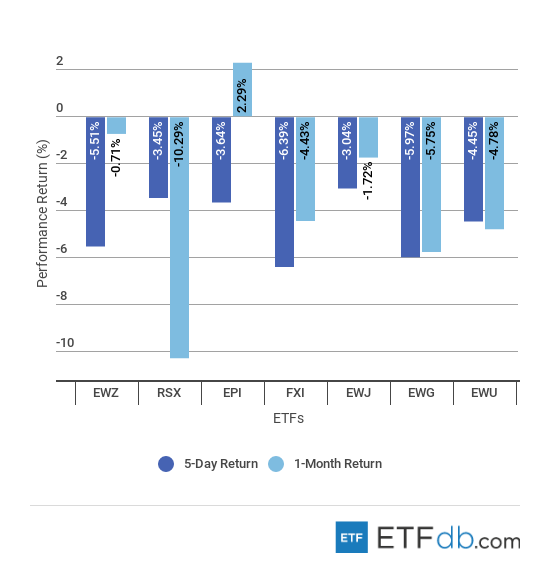
- Foreign equity funds were hit hard during the week, with losses ranging from 3.04% to 6.39%.
- Chinese equities (FXI ) were the worst performers this week as investors turned fearful that the world’s second-largest economy was entering a protracted cooldown.
- The iShares MSCI Germany Index Fund (EWG ) was the week’s second-worst performer, falling 5.97%.
Commodities Review
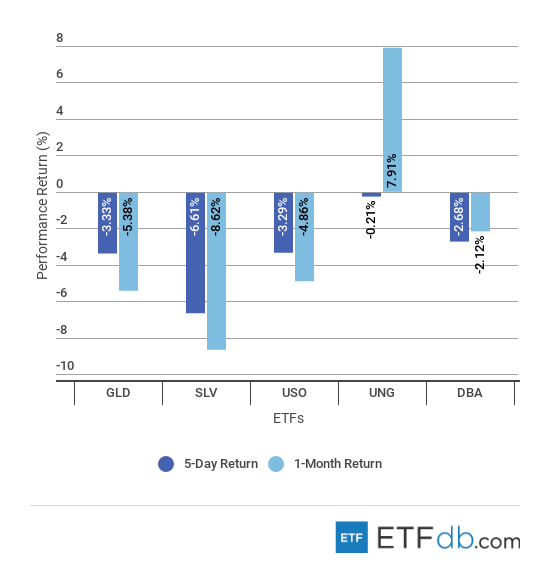
- The commodities picture was overwhelmingly negative this week, with precious metals, oil and agriculture declining sharply.
- Silver (SLV ) plunged 6.61% this week en route to multi-year lows. Gold (GLD ) underwent a similar breakdown, falling 3.33%. With the latest drop, the yellow metal has fallen nearly 14% from its previous peak.
- Crude oil (USO ) was also among the worst performers, falling 3.29%, as rising Saudi production and higher U.S. imports weighed on the market.
Currency Review
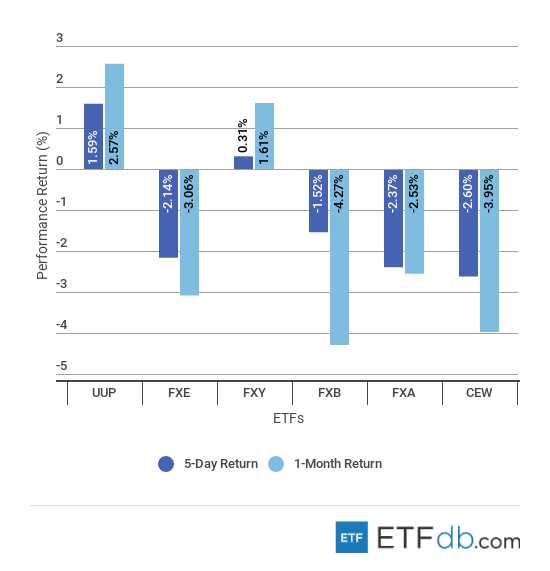
- The dollar bulls controlled the market this week as the Turkish lira imploded and the euro suffered its worst drop of the year. (UUP ) gained 1.59% over the course of the week.
- Emerging market currencies (CEW ) were the biggest decliners this week, falling 2.37%. The commodity- and China-sensitive Australian dollar (FXA ) also fell 2.37%.
- Meanwhile, the Japanese yen (FXY ) managed to tread water this week, amid global risk aversion, and posted gains of 0.31%.
For more ETF analysis, make sure to sign up for our free ETF newsletter.
Disclosure: No positions at time of writing.

